TIME SERIES ANALYSIS AND FORECAST ESTIMATES FOR THE MEAN ANNUAL RIVERINE WATER RUNOFF WITHIN THE UKRAINIAN PART OF THE PRUT AND SIRET BASINS
Lukianets O., Obodovskyi O. Grebin V. Pochaievets O.
Taras Shevchenko National University of Kyiv, Ukraine
Lukianets O., Taras Shevchenko National University of Kyiv;
address: Academician Glushkov Avenue, 2, Kyiv, 02000, Ukraine; email: luko15_06@ukr.net
ABSTRACT
The systematization, generalization, estimation of the variability of time series of the mean annual water runoff of rivers in of the Prut and Siret basins has been carried out, and its cyclic structure has been revealed. For this purpose, a database of average annual discharges water with 12 of hydrological observing stations on the rivers in of the Prut and Siret basins from the beginning of observations to 2015 have been created. Number of years under observation by the annual runoff values for river Prut near city of Chernivtsi is 121. Their representativeness and homogeneity for practical calculations has been evaluated. To identify and formalize the cyclic structure of time series of the mean annual water runoff of rivers in of the Prut and Siret basins used the methods of mathematical statistics and theory of random functions: a function of mathematical expected value; a function of dispersion values or standard deviation; probability distribution function; autocorrelation function. Also have been involved different of the standard mathematical criteria (criteria homogeneity, criteria of the series and of the longest series), integral curves of the differences. As a result, the structure of cyclic oscillations is revealed of the mean annual water runoff of rivers in the Prut and Siret basins and that is what made it possible to provide forecast estimates until 2050.
Keywords: rivers of Prut and Siret basin (within Ukraine); mean annual runoff; multi-annual variability, cyclicity in the runoff fluctuations.
INTRODUCTION
The main aims of study are calculations of hydropower potential of small mountain and foothill rivers in Prut and Siret river basin (within the Ukraine) in wet years and dry years phases. Knowledge of the cyclicity features in the fluctuations of river runoff, duration and character of the change of the periods of the wet years and dry years in river basins, and especially their prediction provides invaluable assistance in the planning and sound management of the water resources, improving the operational efficiency of the hydropower, reclamation and other water facilities.
It is necessary to stress the particular importance of analyzing the temporal variability of Ukrainian Carpathians river runoff Prut and Siret basins. Firstly, they are the wettest rivers of Ukraine, and secondly, the frequent floods, both in warm and cold periods of the year qualify this territory as one of the most flood hazard regions of Europe by the intensity of their development and the simultaneous spread over the territory.
Based on the identified stochastic patterns in fluctuations in multi-annual mean of river runoff in Prut and Siret river basins (within Ukraine), according to observation data, were found theirs forecast estimates for the near future are found.
DATA AND METHODS
A base of average annual discharges water with 12 of hydrological observing stations on the rivers in of the Prut and Siret basins from the beginning of observations to 2015 have been created.
At 83% of gauging stations have periods of observation ≥ 50 years (Table 1).
Fluctuations of mean annual runoff water of rivers are treated as a random process with discrete-time t ϵ T (random sequence). In particular, the value t = 1, 2...N can be attributed to the available number of observations for N years; values t = N+1, N+2... refer to the following periods of time, and the value t = N-1, N-2...- to the previous periods. In order to describe the process fluctuations of mean annual runoff water used the range of functions, the most important of which are: a function of mathematical expected value; a function of dispersion values or standard deviation; probability distribution function; autocorrelation function. Also have been involved different of the standard mathematical criteria (criteria homogeneity, criteria of the series and of the longest series), integral curves of the differences etc.
Table 1. Hydrological observing stations in the Prut and Siret basins, multi-annual mean runoff data and representativeness of its determination
River | Hydrometric station | Catchment area km2 | Mean elevation of catchment area, m a.s.l. | Multi-annual mean | Vаriation coefficient | Number of years under observation | Relative value of mean standard deviation , % | |
Discharge, m3ˑs-1 | Specific discharge, dm3· s-1· km-2 | |||||||
The Prut and Siret basins | ||||||||
Prut | Vorokhta | 48,3 | 1500 | 1,99 | 41,1 | 0,27 | 38 | 4,6 |
Tatariv | 366 | 1200 | 7,76 | 21,2 | 0,26 | 56 | 3,6 | |
Yaremche | 597 | 960 | 12,4 | 20,8 | 0,28 | 66 | 3,5 | |
Chernivtsi | 6890 | 450 | 73,0 | 10,6 | 0,29 | 121 | 3,5 | |
Kamyanka | Dora | 18,1 | 0,37 | 19,5 | 0,38 | 67 | 4,7 | |
Chornyava | Lyubkivtsi | 333 | 1,60 | 4,80 | 0,42 | 31 | 7,9 | |
Bilyi Cheremosh | Yablunytsia | 552 | 1200 | 9,77 | 17,1 | 0,38 | 58 | 5,1 |
Chornyi Cheremosh | Verkhovyna | 657 | 1200 | 14,1 | 21,5 | 0,37 | 58 | 5,0 |
Cheremosh | Usteriky | 1500 | 1100 | 27,9 | 18,6 | 0,25 | 58 | 3,4 |
Iltsya | Iltsi | 86,1 | 1,67 | 19,4 | 0,29 | 57 | 4,0 | |
Putyla | Putyla | 181 | 960 | 2,57 | 14,2 | 0,34 | 51 | 4,9 |
Siret | Storozhynets | 672 | 590 | 6,65 | 9,90 | 0,39 | 63 | 5,0 |
RESULTS AND DISCUSSION
The greatest success in the study of temporal runoff fluctuations can be achieved if one considers the long time series of hydrological characteristics in large scale (Lukyanets et al., 2015), i.e. the water runoff of large basins which are not significantly affected by the random factors and local conditions.
For the establishment of the patterns of long-term fluctuations of in the Prut and Siret basins rivers’ runoff and given the above circumstances, were investigated the average annual runoff values for river Prut near city of Chernivtsi (F = 27,540 km2, 1895-2015). Number of years under observation by the annual runoff values for river Prut near city of Chernivtsi is 121 (Fig. 1).
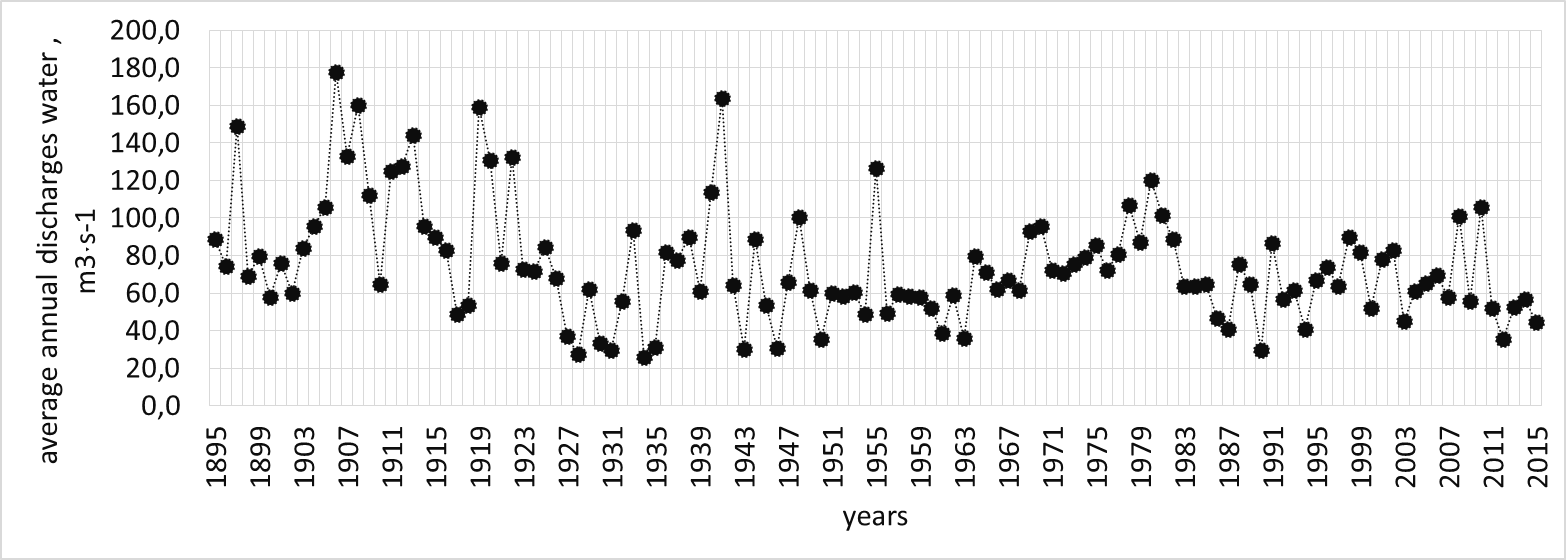
Fig. 1. Long-term fluctuations in average annual water runoff
of the Prut River – a city of Chernivtsy
Quantitative assessment of intra-series homogeneity of the average annual water discharges for river Prut – city of Chernivtsi (Table 2) is performed by generalized standard parametric criteria: Student - to test the significance of the mean values (statistics t) and Fisher - to check the relation of variances (statistics F). As to the non-parametric criteria, one of the most stringent criteria is used-Wilcoxon-Mann-Whitney criterion (statistics of the number of inversions U).
Table 2. Results of test for homogeneity of average annual water runoff of the Prut River (Significance level of 2α = 5 %)
Homogeneity criteria | Statistics value | Results of hypothesis test | |
empirical | theoretical | ||
Student’s, statistics t | 1,95 | [-1,98,+1,98] | homogenous |
Fisher’s, statistics F | 2,33 | [+1,+1,61] | heterogeneous |
Wilcoxon-Mann-Whitney U | 2434 | [1719, 2571] | homogenous |
As you can see (Table 2), the hypotheses of the Student's t and Wilcoxon-Mann-Whitney criteria about homogeneity of the average annual runoff series in the studied basin at a significance level of 2α=5 % are not rejected. Only the hypothesis of series homogeneity for a relation of variance with F statistics at significance level of 2α=5 % is rejected, i.e. difference of the empirical data with the null hypothesis is statistically significant.
The apparatus of the random process theory is applied in the hydrological studies for the description of the time sequences, which examines patterns of random phenomena in the dynamics of their development.
The cyclic fluctuations (cyclicity) means the variability of time series values that have varying degree of regularity, subject to the existence of mathematical expectations of the parameters of these fluctuations. The way to identify tendencies of the grouping of years with relatively large and small runoff values which the presence of cyclical trend is a graphical analysis integral curves of the differences St:
 (1)
(1)
Where: modular factor ki is the ratio of  (
( – the arithmetic mean of the whole series
 – variation coefficient of the series members.
For the analysis of long-term fluctuations, build (Fig. 2) integral curves of the differences of average annual water discharges of rivers in the Prut and Siret basins.
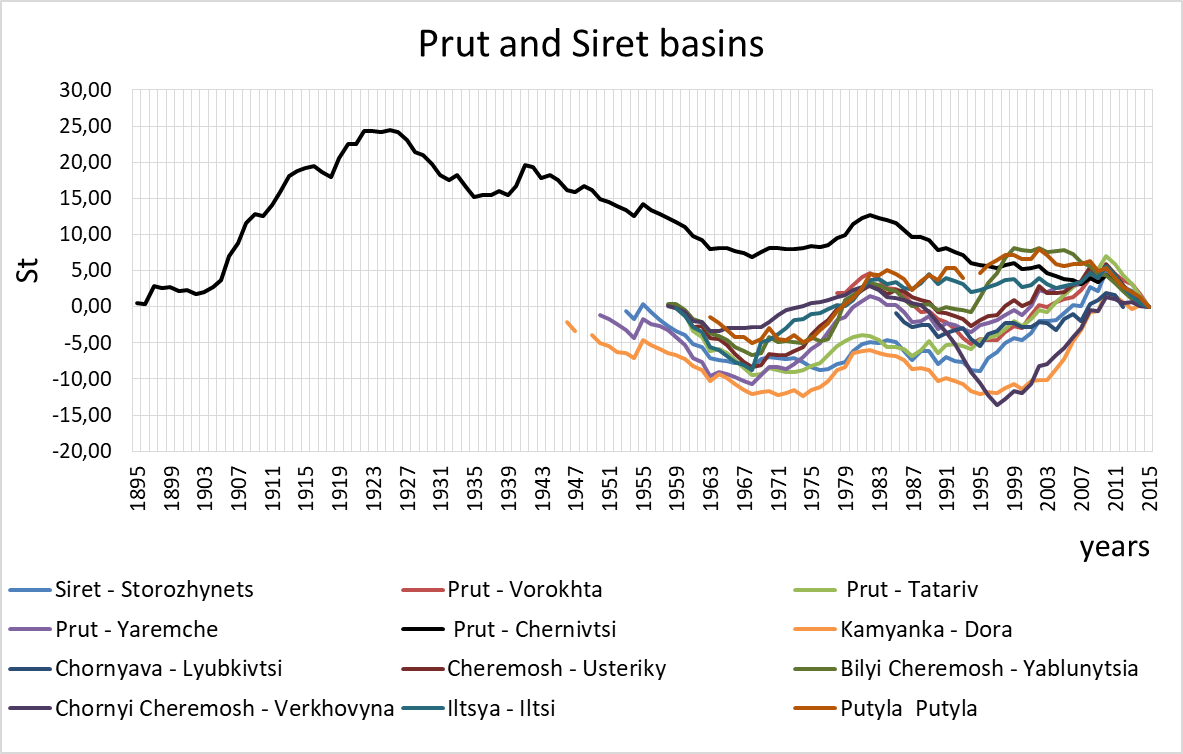
Fig. 2. Integral curves of the differences of multi-annual mean annual water discharges
of rivers in the Prut and Siret basins
Positive increasing of function St (a wet phase) on average means the increase of water runoff. Negative decreasing of function St (a dry phase) characterizes the average reduction of water runoff.
The statistical reliability of the existence of such wet and dry phases, and therefore a breach of stationary conditions can be checked by means of criteria of the series and of the longest series (Obodovskyi et al., 2017), as well autocorrelation function.
Criteria of the series revealed a statistically significant tendency to frequent changes in dry and wet values of water runoff.
Analysis of the sequence of the groups demonstrated that the longest length relates to the series consisting of elements of dry groups and for river Prut – a city of Chernivtsi is 8 yare (from 1956 to 1963). Theoretically proved that the grouping of low-water years for the studied rivers in the Prut and Siret basins can be 10 ± 2 years.
In order to formalize the long-term fluctuations of annual water runoff of in the Prut and Siret basins rivers’ runoff as cyclical fluctuations with groups of years of high and low values (dry and wet phases) and evaluate their quantitative parameters (duration, intensity), the autocorrelation analysis of time series of average annual water for river Prut – city of Chernivtsy was appropriate and made (Fig. 3). The application of this method is based on the acceptance of the hypothesis of stationary processes that cause fluctuations in the studied values.
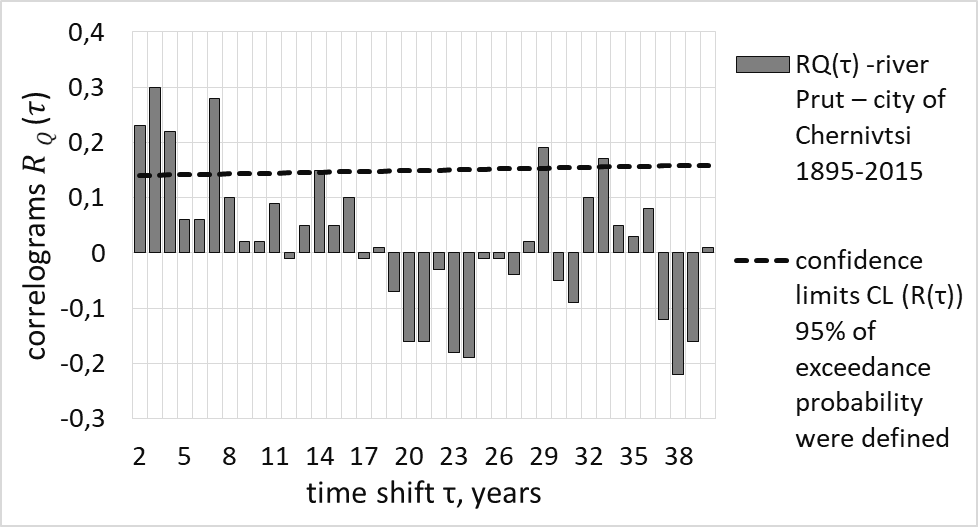
Fig. 3. Correlogram of time sequences of average annual water consumption for the Prut River – city of Chernivtsy
Autocorrelation function characterizes the closeness of the relationship between the members of the time sequence of annual water runoff Q(t). The function RQ(τ) is a sequence of linear correlation coefficients calculated with different distances between sections (or shift values) of the average annual water discharges on the time axis data (Lukianets et al., 2015, Lukianets, 2017).
In practice of the hydrological calculations, the following restrictions are assigned for shift τ: τ =1/3 n. The scope of shift values is taken from τ = 2 to τ = 40, given the length of observations n for studied sequences of average annual water discharges (for river Prut – city of Chernivtsy – 121 years) (Fig. 3).
To assess the statistical significance of defined ordinates of the autocorrelation function the confidence limits CL(RQ(τ)) 95 % of exceedance probability were defined (Table 3).
Table 3. Confidence limits CL(RQ(τ)) 95% of probability of exceedance of the autocorrelation functions of average annual water runoff for river Prut – city of Chernivtsy
River - hydrological station | CL(RQ(τ)) 95% | ||
Lower limit | Upper limit | ||
river Prut – city of Chernivtsy | 0,14 | 0,16 | |
When reviewing the estimates of cycles, it is revealed that in the basins of Prut and Siret the cycles with a duration of 2-4, 7, 14 and 29, 33 years dominate. The first of them relate to the rain floods in the Carpathian Mountains, which form the internal peaks in basic cycle (or phases of water content). Basic cyclicity of 29 years is a repeatability in this cycle of years groups with high and low water content (dry and wet phases).
For the forecast estimates of water runoff fluctuations, the water content phases were allocated in the runoff series of the Prut River – city of Chernivtsy, given the basic cycle frequency (29 ± 2 years), defined duration of low-water phases (10 ± 2 years) (Table 4, Fig. 4).
Table 4. Average water discharges for a period of water content phases and forecast estimates of the runoff for the period until 2050
Period (years) | Phase water content | Number of years in phase | Period average water content discharges (m3 ·s-1) river Prut – city of Chernivtsy, F=6890 km2 |
↑ - wet, ↓ - dry | |||
1883-1898 | ↑ | 15 |
|
1899-1911 | ↓ | 13 |
|
1912-1927 | ↑ | 16 | 93 |
1928-1939 | ↓ | 12 | 56 |
1940-1955 | ↑ | 16 | 73 |
1956-1964 | ↓ | 9 | 54 |
1965-1981 | ↑ | 17 | 83 |
1982-1992 | ↓ | 11 | 62 |
1993-2009 | ↑ | 16 | 69 |
The forecast values with standard deviations in phase water content (m3 ·s-1) | |||
2010-2020÷21 | ↓ | 11÷12 | 57±4 |
2021-2037÷38 | ↑ | 16÷17 | 80±9 |
2038-2048÷49 | ↓ | 11÷12 | 57±4 |
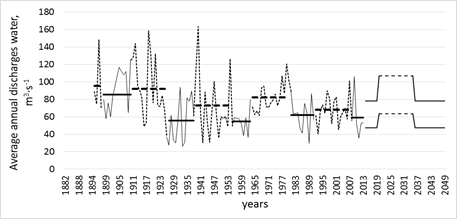
Fig. 4. Fluctuations in water content and their forecast estimates for the Prut River
As the calculations demonstrated there is a clear cyclical variability for all rivers in the Prut and Siret basins, which is well evident in Fig. 5, which demonstrates the ratio of multi-annual mean discharges of rivers for Prut and Siret basins and their values in the periods of dry and wet phases.
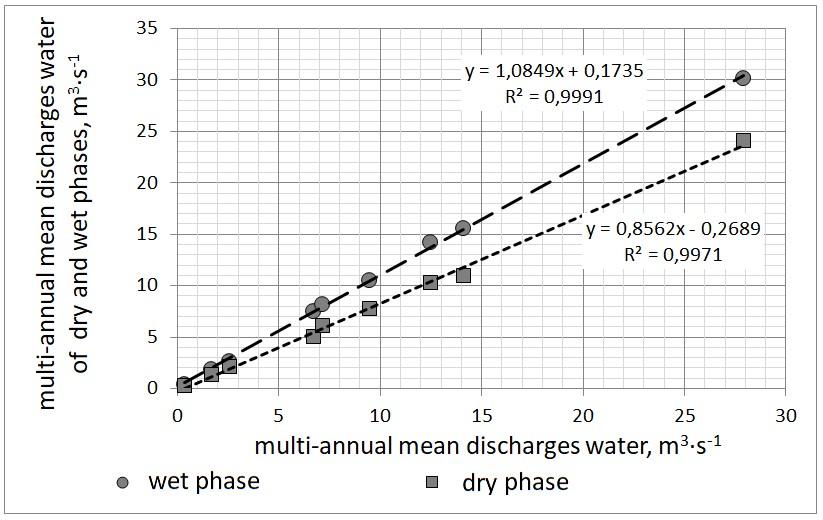
Fig. 5. Ratio between multi-annual mean water discharges and multi-annual mean water discharges of dry and wet phases of the Prut and Siret rivers
Probable errors in determining multi-annual mean discharges water of dry and wet phases of the rivers Prut and Siret are generalized (Table 5). They are presented as a percentage and determined by the ratio of values of average water discharges in the corresponding water-content phase.
Table 5. Probable deviation of calculated values of average water runoff in dry and wet phases
River basins | Probable deviation of calculated values of average water runoff, % | |
wet phase | dry phase | |
river Prut and Siret | ± 11 | ± 7 |
High availability of the proposed equations and significance of built relationships (approximation of all reaches R2 = 0,99) enabled to generalize for rivers of basins of Siret and Prut probable average water discharges which can be expected in the dry and wet phases of the cycle, depending of their multi-annual mean discharges water values (Table 6).
Table 6. The generalized ratio of average water discharges of the Prut and Siret river basins
in periods of dry and wet phases
Longstanding average water discharges, m3 ·s-1 | Water content | Difference in the phases |
| Longstanding average water discharges, m3 ·s-1 | Water content | Difference in the phases | ||
wet phase, m3 ·s-1 | dry phase, | wet phase, m3 ·s-1 | dry phase, m3 ·s-1 | |||||
0,5 | 0,72 | 0,16 | 0,56 | 22,0 | 24,04 | 18,57 | 5,47 | |
1,0 | 1,26 | 0,59 | 0,67 | 24,0 | 26,21 | 20,28 | 5,93 | |
2,0 | 2,34 | 1,44 | 0,90 | 26,0 | 28,38 | 21,99 | 6,39 | |
3,0 | 3,43 | 2,30 | 1,13 | 28,0 | 30,55 | 23,70 | 6,85 | |
4,0 | 4,51 | 3,16 | 1,36 | 30,0 | 32,72 | 25,42 | 7,30 | |
5,0 | 5,60 | 4,01 | 1,59 | 32,0 | 34,89 | 27,13 | 7,76 | |
6,0 | 6,68 | 4,87 | 1,81 | 34,0 | 37,06 | 28,84 | 8,22 | |
7,0 | 7,77 | 5,72 | 2,04 | 36,0 | 39,23 | 30,55 | 8,68 | |
8,0 | 8,85 | 6,58 | 2,27 | 38,0 | 41,40 | 32,27 | 9,13 | |
9,0 | 9,94 | 7,44 | 2,50 | 40,0 | 43,57 | 33,98 | 9,59 | |
10,0 | 11,02 | 8,29 | 2,73 | 42,0 | 45,74 | 35,69 | 10,05 | |
12,0 | 13,19 | 10,01 | 3,19 | 44,0 | 47,91 | 37,40 | 10,51 | |
14,0 | 15,36 | 11,72 | 3,64 | 46,0 | 50,08 | 39,12 | 10,96 | |
16,0 | 17,53 | 13,43 | 4,10 | 48,0 | 52,25 | 40,83 | 11,42 | |
18,0 | 19,70 | 15,14 | 4,56 | 50,0 | 54,42 | 42,54 | 11,88 | |
20,0 | 21,87 | 16,86 | 5,02 |
| ||||
CONCLUSIONS
Time series of average annual water runoff for basins of Prut and Siret rivers were estimated with the use of mathematical tools. The methodological framework of which is based on a statistical means of summarizing, systemization of the input data, evaluation methods of time random sets of the runoff characteristics, methods of analysis of the time series variability and the manifestation of their structure.
High reliability of the cycles with periods of 29 ± 2 years demonstrates a stable frequency of wet phases (17 ± 2 years) and dry phases (10 ± 2 years). That is to say, the features found in the structure of the time series of average annual runoff of the rivers of basins Prut and Siret can be qualified as cyclical. That is what made it possible to provide prediction estimates of the water content for the rivers of basins Prut and Siret. Until 2020-21, the dry phase will continue, and then the wet phase with the duration of 16-17 years can be expected and from 2037-38 the dry phase will again continue until 2048-49.
REFERENCES
Lukianets Olga & Obodovskyi Iurii Spatial, Temporal and Forecast Evaluation of Rivers’ Streamflow of the Drainage Basin of the Upper Tisa under the Conditions of Climate Change. Scientific Journal: Environmental Research, Engineering and Management, 2015. № 71(1). P. 36-46.
Olga Lukianets Stochastic regularities of long-term fluctuation of average annual runoff of rivers of Tisza river basin (within the Ukraine). Electronic Book with full papers from XXVII Conference of Danubian Countries on the hydrological forecasting and hydrological bases of water management. 26-28 September 2017, Golden Sands, Bulgaria. 2017. P. 280-290.
Oleksandr Obodovskyi, Olga Lukianets Patterns and Forecast of Long-term Cyclical Fluctuations of the Water Runoff of Ukrainian Carpathians Rivers. Scientific Journal of Environmental Research, Engineering and Management, 2017. Vol. 73, № 1. P. 33-47.