STATISTICAL ANALYSIS OF THE RUNOFF IN THE EAST MECSEK REGION (HUNGARY) IN ORDER TO UNDERSTAND CLIMATIC VARIABILITY BASED ON HYDRO-METEOROLOGICAL RECORDS
Dániel Koch¹, Enikő Anna Tamás¹, Beáta Bényi¹
1 National University of Public Service, Faculty of Water Sciences, Baja, Hungary Corresponding author:
Enikő Anna Tamás, NUPS FWS, H-6500 Baja, Bajcsy-Zs.u.14., tamas.eniko.anna@uni-nke.hu
ABSTRACT
Hydro-meteorological investigation of the small catchments of the East region of the Mecsek hills has been carried out since the 1960s. In frame of the research, daily water levels of the main creek of the region (Völgységi-creek) have been recorded at two gauging stations: for the upper reach in Magyaregregy settlement and for the lower reach in Bonyhád city. On the upper reach the water levels of one of the most important tributaries of the Völgységi-creek: Hodácsi-creek are also recorded. There are three rain gauges as well that record daily rainfall since the 1960s.
In our study we carried out statistical analyses of the 50 years long data series of the above-mentioned hydrometeorological measurement stations, and we provide information about the changes that can be observed in the runoff characteristics of the creeks, we as well established correlations between the rainfall and the runoff characteristics and determined the extremities and the changes in their frequencies of occurrence.
The above studies can help us understand the climatic changes i.e. in the temporal distribution of the rainfall and runoff and may help us develop better strategies in order to prepare for the probably more frequently occurring flash floods.
INTRODUCTION
Flash floods are frequently associated with violent convection storms or thunderstorms of a short duration falling over a small area. Flash flooding can occur in almost any area where there are steep slopes; it is common in mountainous regions subject to frequent severe thunderstorms. Flash floods are often caused by heavy rain of short duration. Flooding caused by flash floods frequently washes away houses, roads and bridges over small streams and has a critical impact on communities living in these often-remote areas (Andjelic & Szöllősi-Nagy, 2019).
Rainfall events with high intensity in small catchments with a steep land surface slope like mountainous catchments can create so-called flash floods. They are characterized by a short time to peak as well as a relatively short flood event time, critical or supercritical flow (Bornschein, 2019).
Because of the steep surface the time of concentration is rather short: it takes a few ten minutes or a few hours in a few 10 km2 catchment areas exposed to the rainburst. The fast concentration results in very intensive flooding. The intensity of water level rising can fall in the magnitude of meters in an hour. The intensive rising of water level is expected to cause fast change of water surface slope so the instant discharge of water can be surprisingly great. As extreme rainfall intensities cause the extreme discharge, the possibilities of forecast of flash flooding are similar to the cloudbursts. The earliest signal can be earned from the rainfall detection. The most direct solution is the water level detection. The rainfall based nowcast can be gained from real time measurement and sampling of rainfall, rainfall distribution of storm clouds by radar. The rainfall radar can give spatially continuous estimation of rainfall intensity distribution. The technical solutions of the radar estimation and the connecting technical and theoretical problems are discussed in several studies (Testic, Y. Firat, 2013).
The flood control against flash floods is very difficult. The fast-moving character of the flash flood, the rapid runoff and accidental water level rising cause that operative flood control – building of defense lines for riverside territories – after a forecast (nowcast) or during the flood can be successful only in rare cases (Rácz, 2019).
METHODS AND DATA (STUDY AREA)
Völgységi creek can be found in the southwestern part of Hungary (Fig. 1) in the northern part of Mecsek hills, where it collects waters from the eastern part of the so-called Völgység region. The creek is not regulated on its upper reach, until the settlement Szászvár (Fig. 2). Along the creek there were artificial ditches for watermills in the past, which have by now been filled up in most locations. The creek first flows from the south to the north, and upstream the settlement Magyaregregy it turns eastwards. Downstream of Bonyhád town it once more turns to the north - northeast and finally discharges into the Sió channel, next to the settlement Sióagárd. The size of the catchment is around 560 km2 while the length of the creek is 53 km.
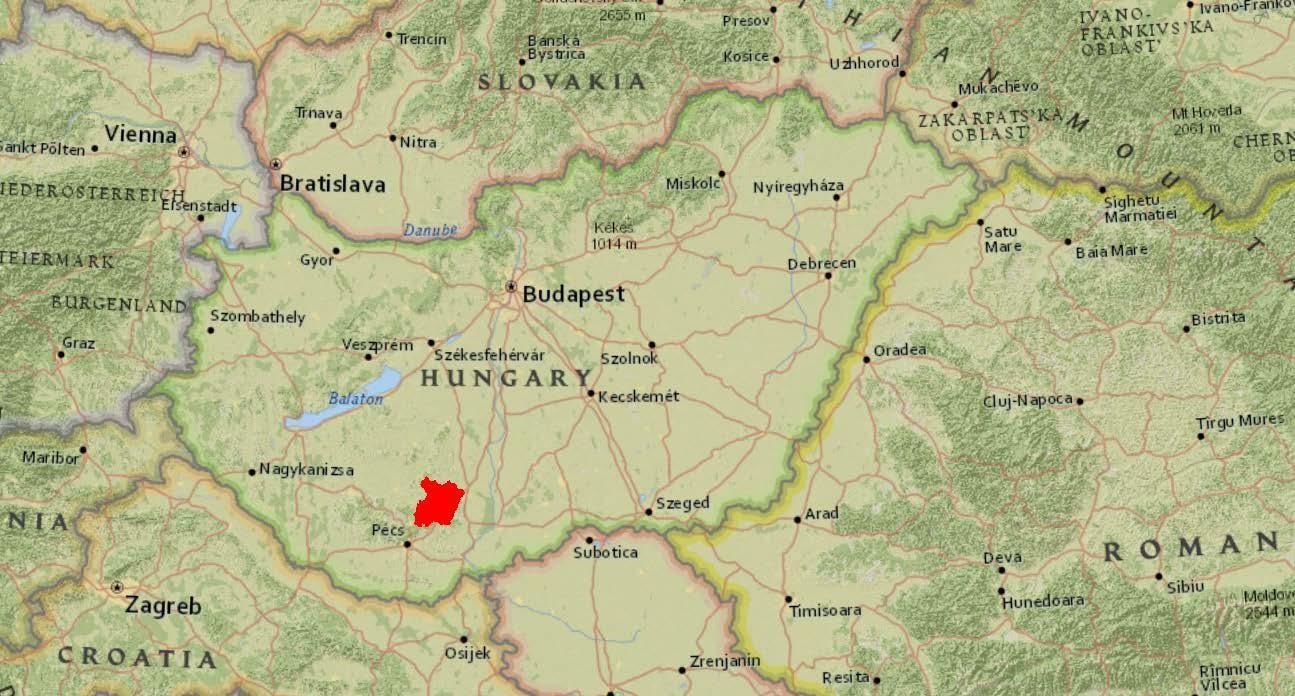
Fig. 1. Overview map of the study area
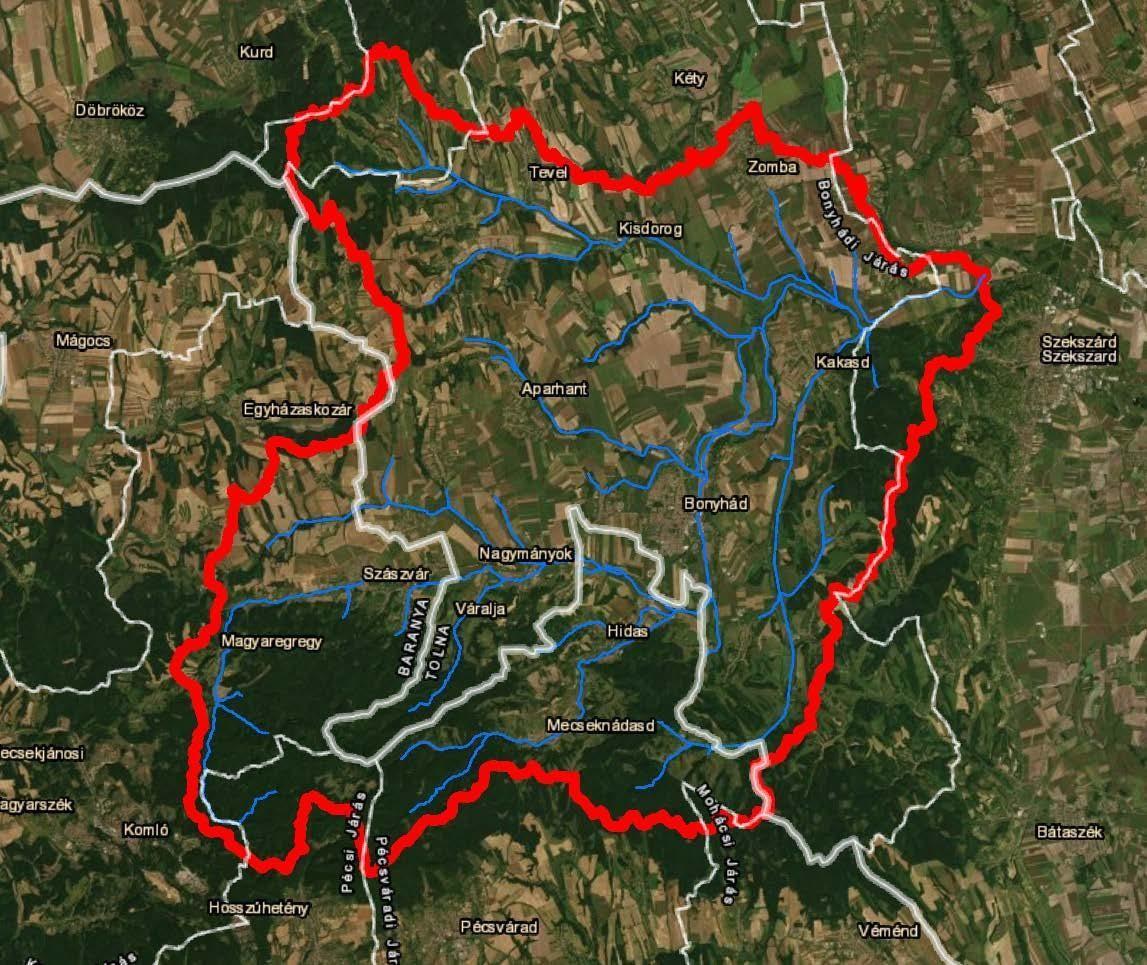
Fig. 2. Overview of the Völgységi catchment
The main valley can be categorized into three parts: the upper reach stretches from the sources until Kárász settlement, the middle reach from Kárász to Nagymányok, while the lower reach from Nagymányok to Sióagárd.
On the upper reach from the Takanyó-valley to the Máré-valley there is a characteristic erosion area, the small creeks flow in rocky beds (Marosi, 1990). We can observe that the creek reacts very quickly to rainfall and can produce high flood waves. Recession time is relatively long (Koch et al., 2019). On the relatively long reach from Kárász to Nagymányok the bedrock already cannot be found on the surface as there are thick alluvial layers on top of it. Along this reach the catchment can be divided into two parts, a hilly, high slope part which is to the south of the creek and a lower elevation, smaller slope part in the north.
Until Nagymányok there are 10 bigger tributaries of the Völgységi creek, transporting a large amount of sediments into the main valley. In the Völgység region there have been oak, ash and elm gallery forests while on the hilltops oaks and turkey oaks were dominant with steppe grasslands, but to date the agricultural utilization of the land has become predominant (Ádám et. al. 1981; Marosi, 1990).
The climate of the Völgység region forms an intermediary type between the continental and the sub-atlantic type of the surrounding regions. From the viewpoint of flash flood development, the Mecsek hills are the most important, as the topographical system of the hills has a high impact on the climate of the region. In the Mecsek hills the sub-mediterranean effects can be observed well. There can be climatic differences between the northern and the southern hillslopes as the ridges act as climatic confines. The annual precipitation of the northern and higher areas is 800 mm while the other parts it is 700 mm. There are rain gauges installed in the catchment area which can record 24 h precipitation averages. Main wind direction is northeast - north. 34% of the annual precipitation falls between March and June, while 53-57% in the summer months. The number of sunny hours of the area is between 1950-2000 annually. On the contrary, the number of snowy days is only 30-50 per annum. Snow usually can be observed for a longer time on the northern slopes. The number of stormy days is above 44 days in the Mecsek hills, while in the northeastern part it is 32-36 days (Bezdán, 1995; Sziebert, 1998).
Gauging stations
For the analyses we had the data of all 3 installed gauging stations, 2 on the main river and 1 on one of the upstream right-bank tributaries, the Hodácsi-creek (Fig. 3; Fig. 4). The most upstream station out of the two on the main creek is at rkm 44,75 in Magyaregregy which is operated by the Southern Transdanubian Water Authority (hq in Pécs), where observation is continuous since 1969. The other station is at rkm 20,00 in Bonyhád town, which is operated by the Middle Transdanubian Water Authority (hq in Székesfehérvár). Here observations are recorded since 1953 daily. This latter station is a part of the master network of hydrological observations of Hungary. About the tributary there are data since 1968, operated by the Southern Transdanubian Water Authority. In the observation sections we can find built-in measurement structures (Fig. 3) (Kovács, 2017; Töttösi, 2016).
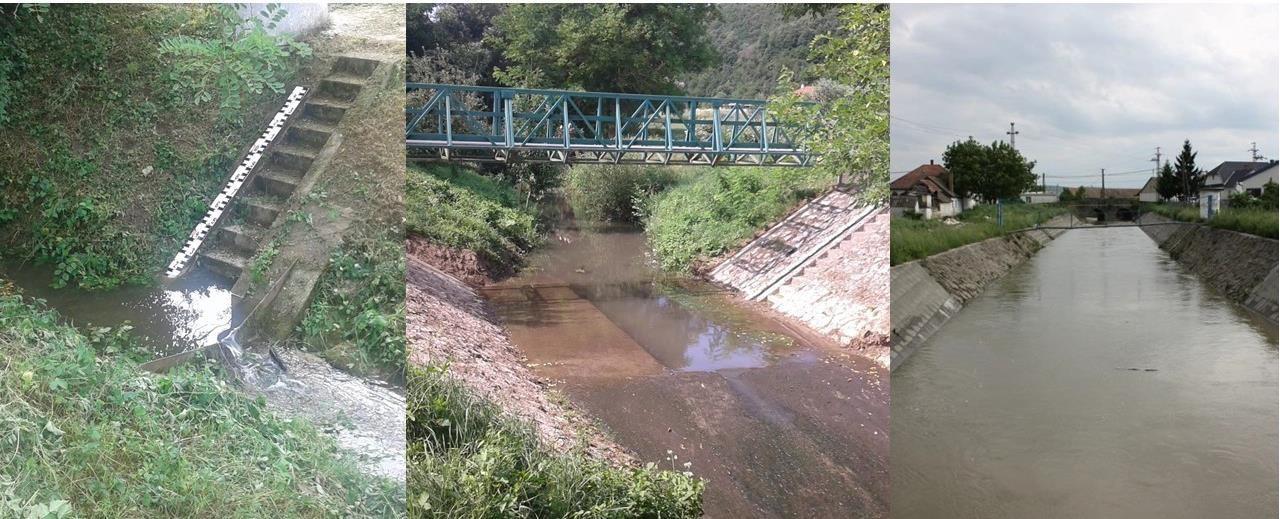
Fig. 3. Gauging stations of the Völgységi creek (photo: T. Kovács; B. Töttösi)
Hydro-meteorological stations
For the analyses we used the data from 3 hydro-meteorological stations - rain gauges (Fig. 4). The station in Váralja is the oldest station of the eastern Mecsek which is still in operation, it was installed in the beginning of the 20th century. It is operated by the Meteorological Information Services of Hungary. The exact placement of the station has changed several times within the village, but it was always located within 1 km from the center. It has been relocated 3 times since the 2nd World War.
The hydro-meteorological station of Máza is the newest station of the eastern Mecsek which is still in operation. It is operated by the Meteorological Information Services of Hungary since 1990. At the moment this station is the only one in the region where several rain measurements are made daily. In the first years the station was situated in a place surrounded by buildings, thus in the years before 2000 inhomogeneity can be detected within the precipitation data series. But the data measured after March 2000 are of sufficient quality and continuous.
In Magyaregregy there is a rain gauging station that is operated by the Southern Transdanubian Water Authority since 1972. The station was, for a long time, located in the southern part of the village but in 2012 it has been relocated with a few hundred meters to the north, so it is now in the middle of the village. In our analyses we used the data from 1973 because the full year data series was available from that date (Szentes, 2015).
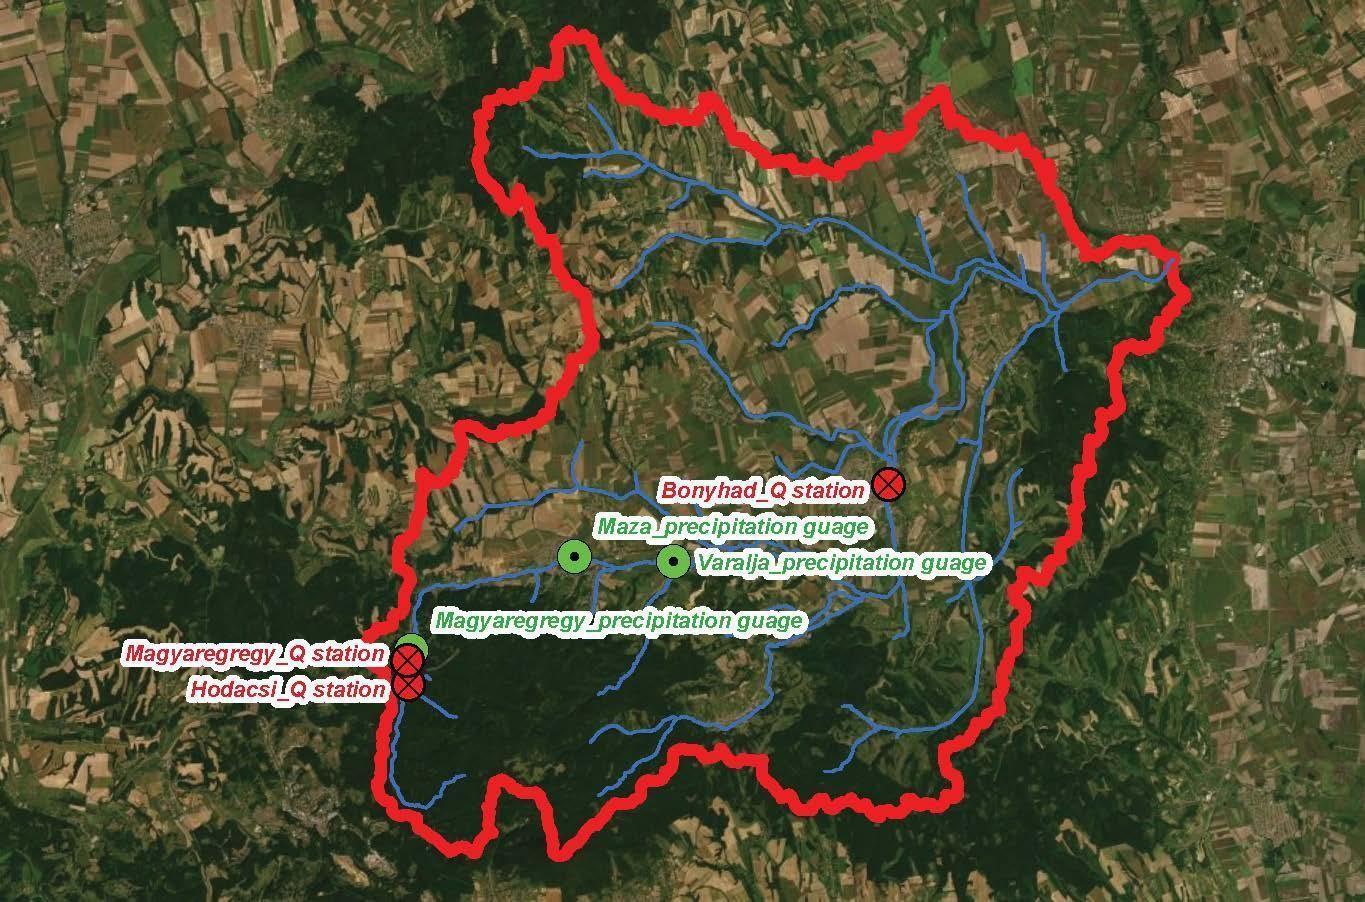
Fig. 4. Discharge and rain gauges in the study area
RESULTS AND DISCUSSION
Flash flood events are important to analyze because these events may reveal aspects of unexpected eventually before unobserved hydrological behavior. Thus, we have carried out a general evaluation based on the available discharge and precipitation datasets in order to conclude statements about the tendencies governing the processes in the studied catchment. We have determined the runoff maxima, minima and averages for all three gauging stations. We determined trends as well.
There are several rain gauges in and around the catchment but some of them are not representative for the study area or is located very close to the confluence where there is no runoff data available as the most downstream gauge is at km 20,00. This way we use the data of the 3 stations presented before. We determined the maxima of precipitation, the number of rainy days as well as the trends, in order to detect eventual effects of climate change.
During our study we had to face with the problem of the lack of systematic observational data, mainly in the case of water level gauges. We have to mention that data gaps were also present in all three data series, 1529 days at Bonyhád, 1019 days at Magyaregregy and 507 days on the Hodácsi creek.
However, our aim was to provide a contribution for the understanding of flash flood processes and to underline the need for developing a monitoring system for flash floods by showing that climate change really has an effect on the frequency of the occurrence of flash floods. Thus, before the investigations, the data set had to be prepared for statistical analysis. First of all, water levels were not uniformly recorded, which means that though there were at least one data every day, but the time of the records were not the same for every day. The other main problem we faced was that though during an event, as a flash flood, measurements were usually more frequently made, however these were not uniformly executed during the process, say every hour.
Since our aim was to investigate floods, we extracted the highest water level from each day from the data set to obtain a uniform time series showing the highest water level of each day. We used this transformed table to detect "interesting" days, were flood events were present, presuming that days when the peak water level was higher than 100 cm can be considered as days with flood events (Fig. 5).
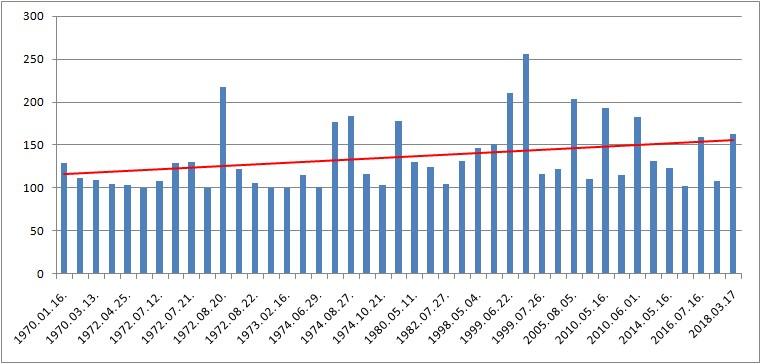
Fig. 5. Linear trend of water levels exceeding 100 cm at the Magyaregregy gauge
The diagram shows the linear trend of growth of the intensity of flood, i.e., the highest water level observed during the flood, over the investigated period. We can observe a slightly increasing trend, and we can state that the floods in the last few decades are more extreme. More precisely, there are 8 floods after 1999 with a peak level of at least 150 cm, while before in the period 1970-1999 there are only 4, which means the frequency of flood events have doubled. We could also observe that in the last ten years there were 6 floods, more than in any of the ten years periods before.
After detecting the time of the floods this way, we investigated each flood independently in order to characterize the runoff and to develop a model for a typical flash flood, eventually to determine the changes that could be observed. Unfortunately, here again we faced the lack of data. Since there were no uniform measures, we do not have reliable information about the runoff and hence we could not make any comprehensive statistical analysis. However, we interpolated the missing data linearly in order to obtain some picture about the events. But we emphasize that especially in the case of flash floods these results can involve significant errors.
As a next step we considered the events such that the water level exceeds 100 cm. Since our aim was to investigate flash floods, we defined F_1 flood as events where the water level increases at least 250 % in one day. The distribution of F_1 flood in the time period 1970-2018 regarding in 10 years periods is:
17%-12%-23%-13%-35%.
Here we see a significant growth in the last decade.
However, looking at the parameters and the runoff properties of the floods, we find it necessary to define the parameters of floods that should be considered in an analysis regarding flash floods requiring more conditions. For instance, one of the characteristics of a flash flood is the short time period of its runoff. This means that the slope of the celerity of the increase and decrease of the water level is great in magnitude. In order to give a measure for this we investigated the water levels a day before the peak, the peak and the day after the peak and determined the proportion of the water levels before and after the peak to the peak level itself. According to these parameters we defined F_2 floods as the floods where neither of these two numbers is greater than 50%. We found that the distribution of F_2 floods are different comparing to F_1 flood, namely:
0%-8%-30%-16%-46%.
We see that more than the 50% of F_2 floods occurred in the last 20 years.
We insert a diagram of the runoff of the flood in 2018 (Fig. 6) which shows up the typical characteristic of a flash flood.
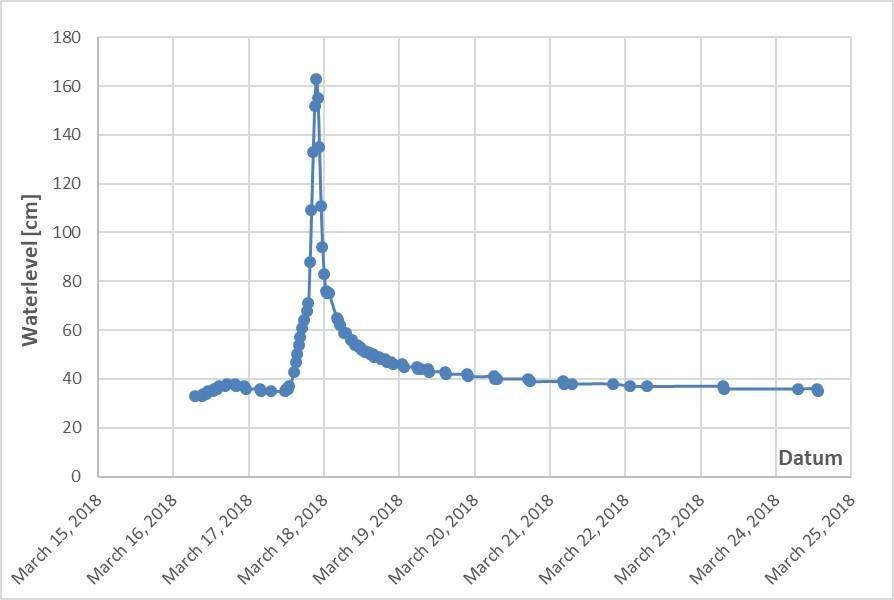
Fig. 6. Hydrograph of a typical flash flood at the Magyaregregy gauge (March 2018)
Runoff data analysis
From the diagram of the yearly maxima we can conclude that the number of high discharges has considerably increased during the past 20 years, increasing the ever-observed peak discharge of the creek several times. Calculating the linear trend of the longest (Bonyhád, 1952-2018) data series a significant increase is visible, which represents a 7.2 m3/s increase (Fig. 7).
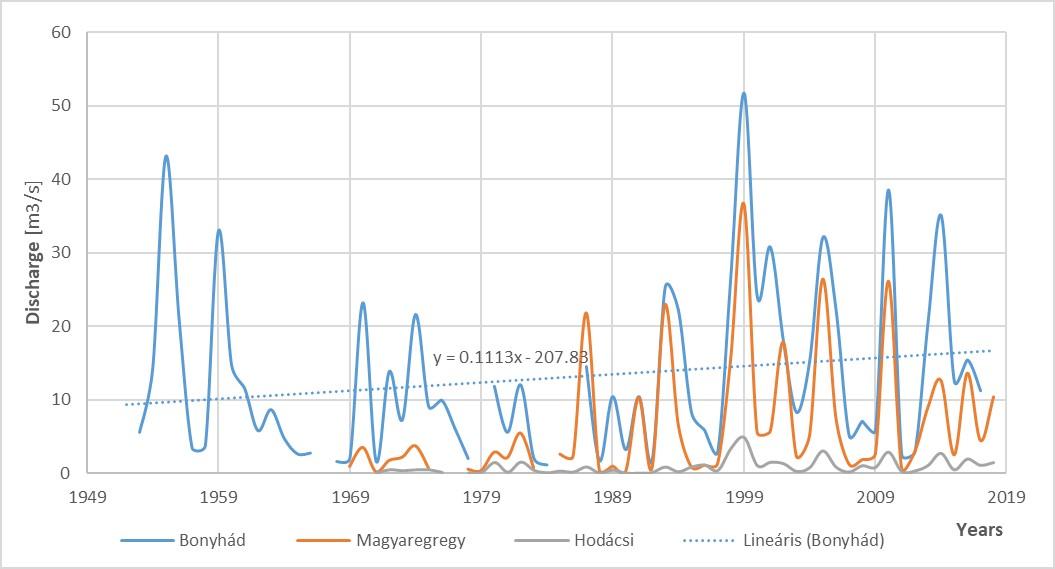
Fig. 7. Maximum yearly discharges of the 3 gauging stations, and their linear trend
at Bonyhád
If we look at the mean discharges (Fig. 8) we can observe a slightly decreasing trend at Bonyhád station, while at the Magyaregregy station a slight increase can be seen, and at the Hodácsi tributary as well. This difference can be attributed to the different length of the data series. Here the data gaps are significant so we can suppose that the decreasing tendency would be present if the data series was long enough.
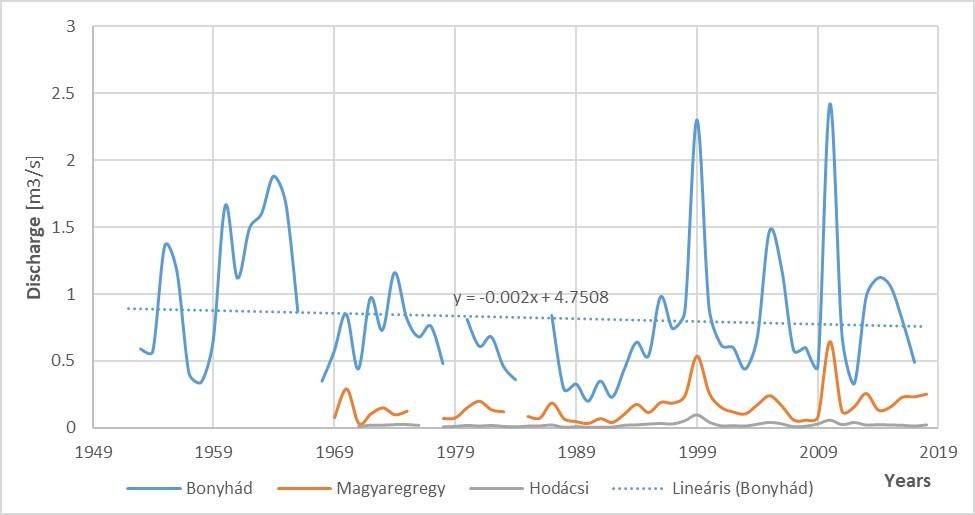
Fig. 8. Average yearly discharges of the 3 gauging stations, and their linear trend at Bonyhád
For the annual minima, we can see a slight decrease at all the three gauging stations, which is particularly true in case we look at the most recent 20 years (Fig. 9).
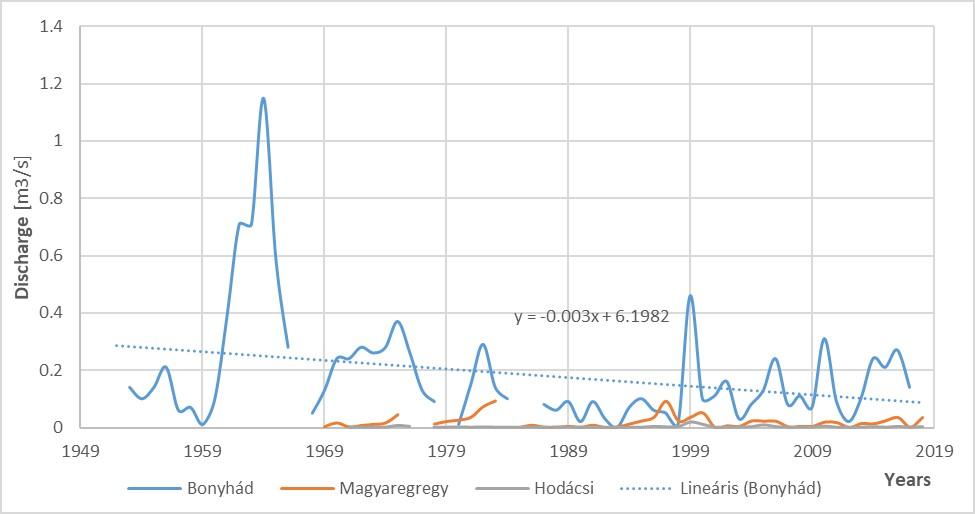
Fig. 9. Minimum yearly discharges of the 3 gauging stations, and their linear trend
at Bonyhád
Precipitation data analysis
The processing and analysis of the precipitation data was made in order to control as well as verify the runoff tendencies. We analyzed the daily precipitation sums of the three rain gauges (Magyaregregy, Váralja, Máza). The longest of the data series is available for Váralja, since 1962. Data gaps in this data series comprise 366 days. At the Magyaregregy station data are available from 1972, with data gaps on 513 days. The last station Máza has unfortunately a very short data series which can only be used from the year 2005, with 61 days of missing data.
In case of annual maxima (Fig. 10), the Magyaregregy station which is closest to the sources shows consequently higher values, which can be explained with the effects of the variability of the terrain. If we compare the values to the runoff data, a correlation can be seen as expected, and the periodicity in the precipitation also results in a similar periodicity in the runoff.
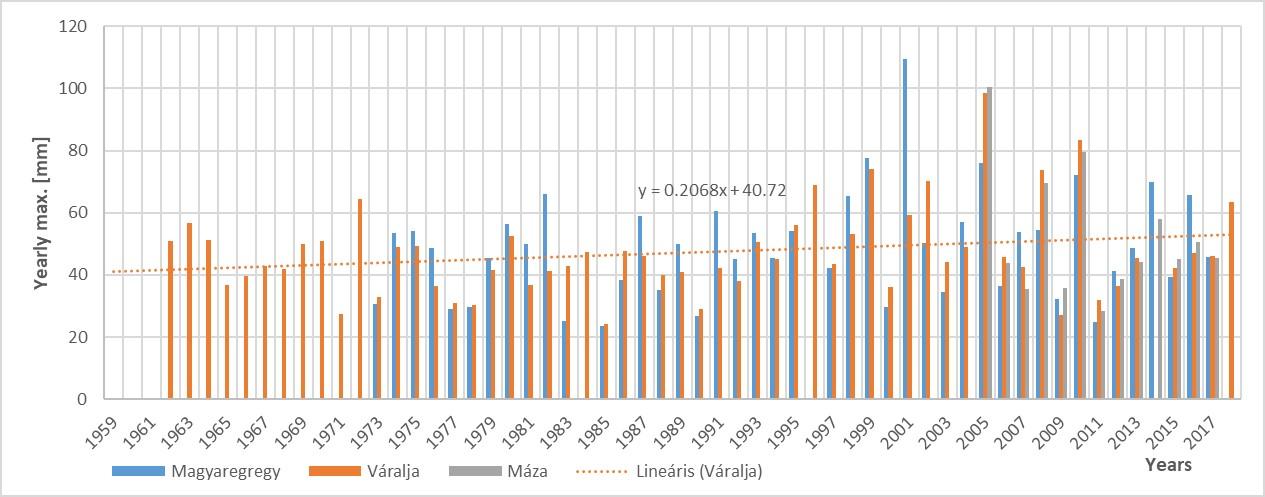
Fig. 10. Maximum yearly precipitation of the 3 gauging stations, and their linear trend
at Váralja
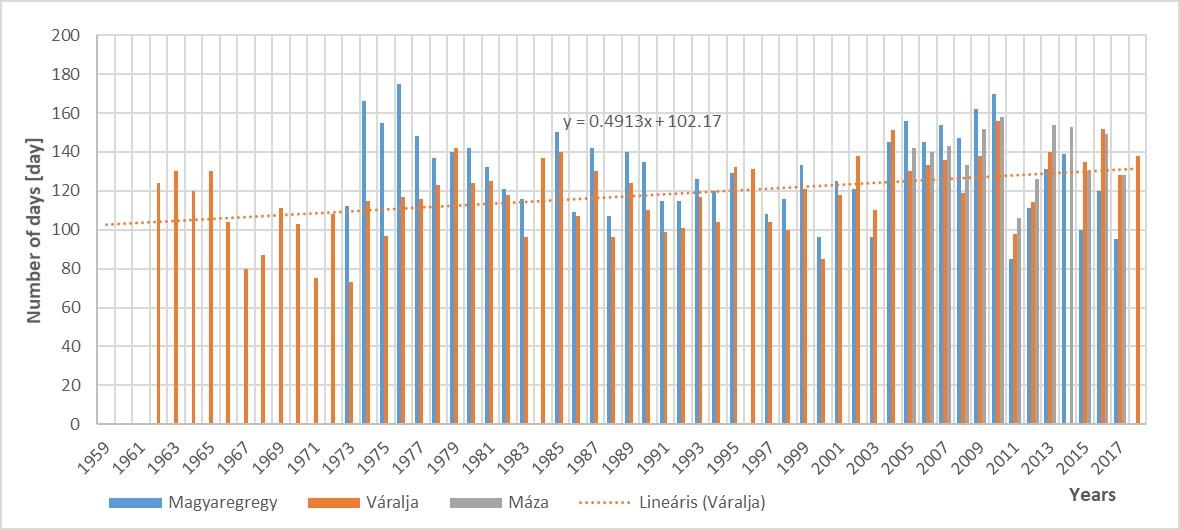
Fig. 11. The number of rainy days at the 3 gauging stations, and their linear trend at Váralja
If we analyze the number of rainy days (Fig.11) and the sum of precipitation (Fig. 12) at the three stations, the effects of climate change can be undoubtedly seen in the study area. The trends of both data series are significantly increasing, meaning a higher number of rainy days within a year and bigger precipitations as well. When we look at the connections with the runoff data, it is difficult to interpret the changes in the average and small discharge data series, but we think a more detailed analysis could show the characteristics causing these changes.
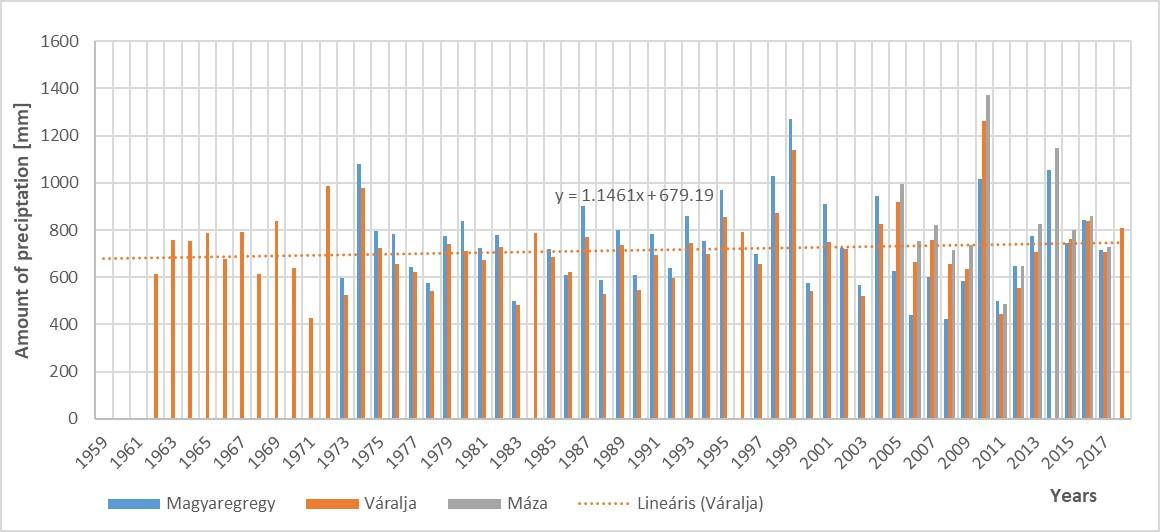
Fig. 12. The amount of yearly precipitation at the 3 gauging stations, and their linear trend at Váralja
Thus, the effect of climate change can already be observed in the study area, not only in the form of more precipitation but also in its extremities. In the past few years, we have also witnessed the most numerous dry periods in Hungary, and a serious drought can also develop right after a very wet year. This is well illustrated by the precipitation sum observed in Magyaregregy in two consecutive years: 1260.6 mm in 2010 and only 445.6 mm in 2011.
CONCLUSIONS
From the analysis of the highest, average and lowest discharges and the precipitation data yearly we can conclude that the precipitation and runoff data series are well related in the case of high and medium discharges, but in case of small discharges this connection is not very evident. The reason for this can be that the smaller tributaries in the mountain range of the catchment dry out totally in longer dry periods.
Looking at the data series in details, we can distinguish between dry and wet periods which can change during a year or a few years. Therefore, trends can be much different depending on the period in which measurements started.
Our simple analyses clearly show that high precipitations and together with them high discharges, peaking at higher and higher levels and causing flash floods more often, have increased in the recent past, approximately during 20 years. We attribute this phenomenon to the effects of the heavy rainfalls which have increased in occurrence and intensity as an early result of climate change.
The small and medium discharges are greater in wet years, and a slight decreasing tendency can be observed in them. There can also be a climate-related answer to this effect which would need further analyses with a finer resolution time and space.
REFERENCES
Ádám, L.; Marosi, S.; Szilárd, J. Magyarország tájföldrajza [Regional geography of Hungary] IV. in: A Dunántúli-dombság. 1981. P. 176-177. Akadémiai Kiadó, Budapest.
Andjelic, I.; Szöllősi-Nagy, A. Flood forecasting. in Tamás et al. (ed) Course materials of the International Postgraduate Course on Flood management, in press. 2019. Bezdán, M. Vízgyűjtő terület feltárására alapozott terepgyakorlat lebonyolítási rendjének kidolgozása. [Developing the execution framework of a field practice based on catchment exploration] Thesis work; Budapest University of Technology. 1995.
Bornschein, A. Flood and excess water control techniques and technologies. in Tamás et al. (ed) Course materials of the International Postgraduate Course on Flood management, in press. 2019.
Koch, D.; Schneck, T.; Zsuffa, I. Árhullámmérések a Kelet-Mecsekben. [Flood Measurements in the EastMecsek Mountains] Műszaki Katonai Közlöny. 2019. Vol. 29:2. P. 105-116., 12 p.
Kovács, T. A. Hidrometeorológiai állomáshálózat korszerűsítése a Völgységi-patak vízgyűjtő területén.
[Development of the hydro-meteorological monitoring network in the catchment area of the Völgységi creek] Thesis work, national University of Public Service, Faculty of Water Sciences, Baja. 2017.
Marosi, S. (1990): Magyarország kistájainak katasztere [Cadastre of Hungarian small regions] II. 1990 szerk. Budapest: MTA Földrajztudományi Kutató Intézet.
Rácz T. Flood protection in urban environment. in Tamás et al. (ed) Course materials of the International Postgraduate Course on Flood management, in press. 2019.
Szentes, O. A. Kelet-Mecsek csapadékviszonyai az 1901-2013-as időszakban. [Precipitation in the eastern Mecsek between 1901 and 2013] Thesis work, Eötvös Loránd University, Department of Meteorology, Budapest. 2015.
Sziebert, J. A magyaregregyi mintaterület információi. [Information about the Magyaregregy experimental area] in: Minta és tájjelemző területeken nyerhető információkkal kapcsolatos tanulmányok. VITUKI Rt., Budapest. 1998.
Testic, Y. Firat. Rainfall. The state of science. Washington: GEOPRESS American Geophisical Union. 2013.
Töttösi, B. Komplex hidrológiai adatfeldolgozás a Völgységi-patak vízgyűjtő területéről. [Comlex hydrological analysis from the catchment area of the Vögységi creek] Thesis work, Eötvös József College, Baja. 2016.