MAXIMUM RIVERINE RUNOFF IN THE BASIN OF TYSA AND PRUT WITHIN UKRAINE
Lukianets O.¹, Malytska L.2, Moskalenko S.¹
1 Taras Shevchenko National University of Kyiv, Ukraine
2 Ukrainian Hydrometeorological Institute, Kyiv, Ukraine
Lukianets O., Taras Shevchenko National University of Kyiv;
address: Academician Glushkov Avenue, 2, Kyiv, 02000, Ukraine; email: luko15_06@ukr.net
ABSTRACT
Research focuses on the objective assessment of maximum river runoff and its multi-annual variability in the basin of Tysa and Prut rivers within Ukraine. For this purpose, a database of maximum riverine water runoff (the highest daily values per year and the largest for one of the terms of daily measurement periods) from 36 measuring stations were created. The series were formed from the beginning of observations until 2015 and in most of them, the length is 50-70 years. Their representativeness for practical calculations has been evaluated. The main statistical parameters of the maximum runoff are determined – norms of water discharge and maximum specific discharges, coefficients of variation and skewness. A comparison was made between the maximum daily runoff values and their corresponding peak maxima. This is especially important for mountain rivers to calculate and predict dangerous peaks maxima on rivers. The multi-annual variability of the maximum runoff of rivers was examined by integral curves of differences, autocorrelation, and spectral functions. The result revealed the structure of cyclical fluctuations and an assessment of trends in the current period.
Keywords: basin of the Tysa and Prut rivers; maximum runoff of the rivers; multi-annual variability; statistical parameters and distribution functions.
INTRODUCTION
The rivers Tysa and Prut belong to the Danube basin and within the boundaries of Ukraine originate in the mountains of the Carpathians. Rain and snow-rain floods are typical for rivers in their basins (Grebin et al. 2013). Often those floods acquire the character of dangerous phenomena with devastating consequences. The characteristic of such an extreme hydrological phenomenon is the maximum runoff of rivers, which serves as a measure of danger for the population and the economy. It has usually expressed as the largest discharge, volume or depth of runoff for the flood wave this year. The maximum discharge can be the largest mean daily discharge, the largest in the observation term (taken in one of the terms of the daily measurement periods) or instantaneous (absolute daily maximum).
METHODS AND DATA (STUDY AREA)
Aim of the research is to estimate the maximum runoff of rivers in the basins of Tysa and Prut and its multi-annual variability. A base of average annual and maximum discharges – largest daily mean values and the largest in the observation term, with 36 gauging stations on the rivers from the beginning of observations to 2015, have been created. At 8 % of the gauging stations, the observation period is ≥ 70 years, 81 % – 50-70 years, so 89 % of gauging stations have periods of observation ≥ 50 years, and only 11 % - ≤ 50 years (Table 1).
The criterion for the sufficiency of the available observation periods and the accuracy of determining the average maximum runoff of rivers is the ratio – the relative value of the standard deviation αn (1) that should not exceed 20 %. According to Table 1, such excesses are available. In the Prut and Siret basins, this is observed only on the river Cherniava – Lubkivtsi, whose period of hydrometric observations is just 28 years (Lukіanets, Moskalenko 2019).
In current research were used methods of mathematical statistics processing of random variables and random functions, as well as statistical analysis of relations between hydrological variables. Practical value is determined by the further development of studies of maximum runoff of the rivers of the Carpathian Mountains and their generalization according to modern observation data
Table 1. Data about the period of hydrometric observations, the sizes of catchment areas
and the relative squared errors in determining the maximum annual runoff of the rivers
of the Tisza, Prut and Siret basins within Ukraine
(according to hydrometric observations: from the beginning to 2015 inclusive)
River basin | Ranges | ||
number of years of the observations | catchment areas F, km2 | relative quadratic error in the determination of long-term values of maximum annual water runoff, % | |
Danube river basin | |||
rivers in the basin of Tysa | 53 ÷ 70 | 25.4 ÷ 9140 | 4.6 ÷ 11.7 |
rivers in the basin of Prut and Siret | 28 ÷ 71 | 18.1 ÷ 6890 | 7.6 ÷ 20.8 |
RESULTS AND DISCUSSION
Explored basins within Ukraine locate on different slopes of the Carpathian Mountains: rivers of Tysa basin – on the southwest slopes, rivers of Prut basin– on the northeastern slopes. This causes certain features of physical and geographical factors in the formation of highs on the rivers in the basins of Tysa and Prut. Ranges of catchment basins of investigated rivers are in the Tysa basin F=25,4 – 9140 km 2, in the Prut basin – F=18,1 - 6890 km 2 (Table 1).
The average maximum runoff of rivers in the observation term in the multi-annual period varies– 17,1-1873 m3·s-1 in the Tysa basin, and 15,7 – 1133 m3·s-1 in the Prut basin. Accordingly, maximum specific discharges runoffs are 90,6 – 1886 and 71,8 – 867 dm3·s-1·km-2 (Table 2).
Absolutes instantaneous of the maximum runoff during observation in the Tysa basin recorded on the river Turia – Turia Polyana (F = 98,6 km2) – 6298 dm3·s-1·km-2, in the Prut basin on the river Kamianka – Dora (F = 18,1 km2) – 4790 dm3·s-1·km-2 (Table 3).
Table 2. The ranges maximum discharge of water of the Tisza, Prut and Siret rivers within Ukraine and the parameters of their variability according to hydrometric observations
(from their beginning to 2015 inclusive)
River basin | Ranges | ||
the maximum for year discharge of water , m3·s-1 | variation coefficient | skewness coefficient | |
Danube river basin | |||
rivers in the basin of Tysa | 17.1÷1873 | 0.37-0,89 | 0.22-5.49 |
rivers in the basin of Prut and Siret | 15.7÷1133 | 0.54-1.1 | 1.49-3.37 |


Table 3. The ranges of long-term values of maximum drainage modules for rivers
of the Tisza, Prut and Siret basins within Ukraine and their maximum values for the period
of hydrometric observations (from their beginning to 2015 inclusive)
River basin | The range of long-term values of average maximum specific discharges runoff , dm3·s-1·km-2 | Instantaneous of the maximum runoff during observation, dm3·s-1·km-2 |
Danube river basin | ||
rivers in the basin of Tysa | 90.6-1886 | 6298 (r. Turya – Turya Polyana) |
rivers in the basin of Prut and Siret | 71.8-867.4 | 4790 (r. Kamianka – Dora) |

The coefficients of variation in the Tysa basin are smaller (0,37–0,89) than in the Prut basin (0,54–1,1). Skewness coefficients have positive values that vary in wide range from 0,2 to 5,5 (Table 2). On small rivers, there are significant differences between the maximum daily average values and peak highs values, but with increasing river length, those differences are less.
The ratio between the maximum daily average values and peak highs values on rivers is very important in the development of methods of calculation and prediction of flood peaks. Such ratios are shown in the example of the Tysa River basin. Fig. 1-2 shows the dependencies between the maximum daily average and peak highs values of water flow of the Tysa River and the Latorica River that have several hydrological posts characterizing different conditions of river water flow (Table 4).
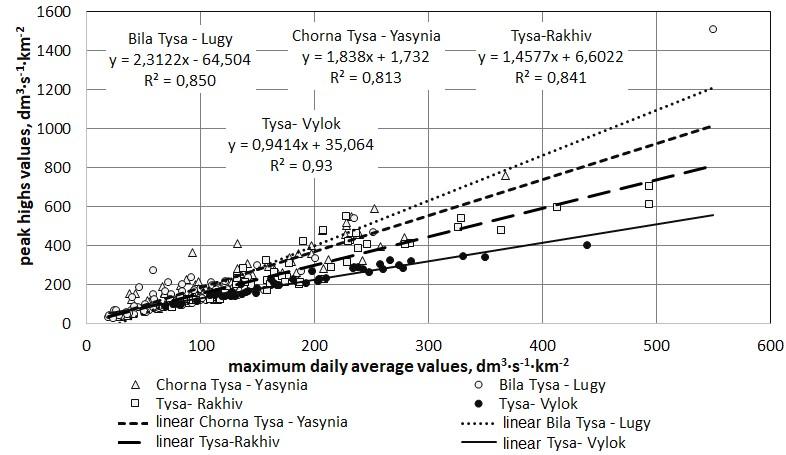
Fig. 1. The ratio between the maximum daily average values and peak highs values of specific discharges runoff of the Tysa River according to observations at the hydrological posts of Yasynia, Lugy, Rakhiv and Vylok
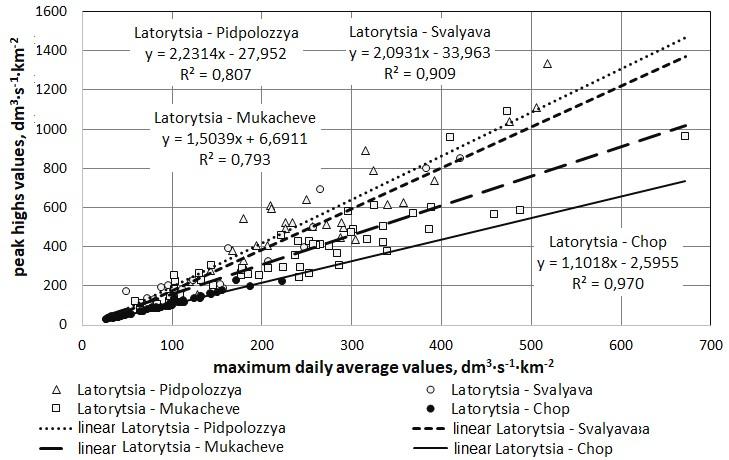
Fig. 2. The ratio between the maximum daily average values and peak highs values of specific discharges runoff of the Latorica River according to observations at the hydrological posts
of Pidpolozzya, Svalyava, Mukacheve and Chop
Analyzing Fig. 1-2 and similar dependencies on the rivers of the Prut and Siret basins, it can be stated that for mountain rivers the maximums exceed the daily average values by 1,7 – 2,2 times, in the foothills – by 1,3-1,6 times, and with access to the plain – 1,0-1,2 times.
Table 4. The weighted mean rivers fall and their basin areas in the Tysa River basin
River Post | Basin area, km2 | Weighted mean river fall, ‰ |
Chorna Tysa – Yasynia | 194 | 15.7 |
Bila Tysa – Lugy | 189 | 26.3 |
Tysa – Rakhiv | 1070 | 9.1 |
Tysa – Vylok | 9140 | 2.9 |
Latorytsia – Pidpolozzya | 324 | 12.3 |
Latorytsia – Svalyava | 680 | 7.4 |
Latorytsia – Mukacheve | 1360 | 4.5 |
Latorytsia – Chop | 2870 | 1.9 |
Naturally, on the rivers of the Tysa, Prut and Siret basins, at the same value of maximum daily average discharge of water, the maximum value in the observation term, in the warm period is higher than in the cold. For mountain rivers this difference can be from 10 % to 30 %, for the plain rivers it is insignificant (Grebin et al. 2013).
Comparative analysis of maximum and average annual runoff of water in discharges has shown that first one is on 9-16 times bigger than average (Lukianets 2017; Lukіanets, Moskalenko 2019).
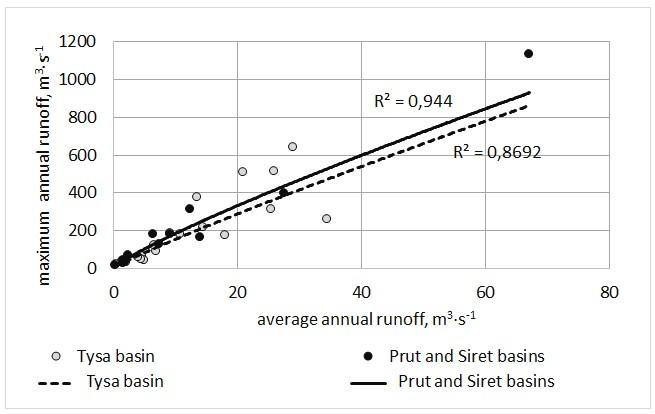
Fig. 3. Comparative analysis of maximum and average annual runoff of the rivers
in the basins of Tysa, Prut and Siret
Integral curves of differences, autocorrelation and spectral functions were used to study the multi-annual variability of the maximum runoff of rivers (Fig. 4-6, Table 5-6).
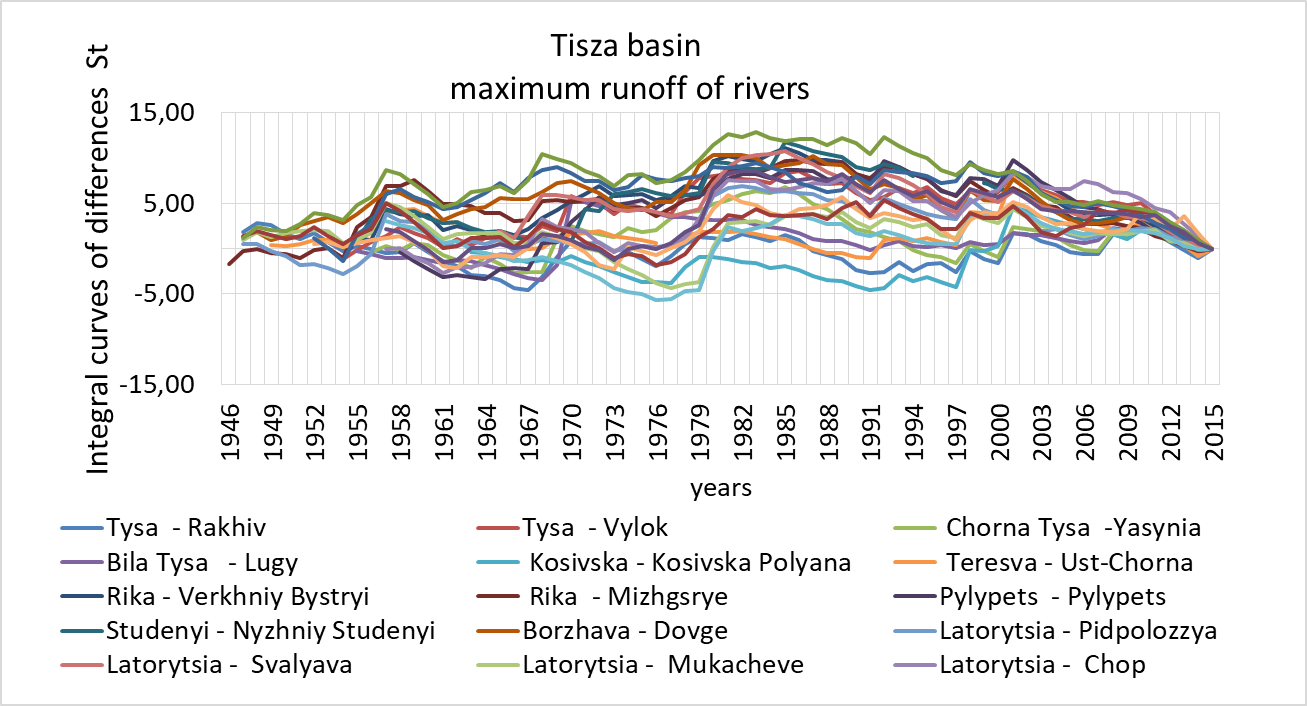
Fig. 4. Integral curves of differences maximum per year runoff of rivers Tysa basin
within Ukraine
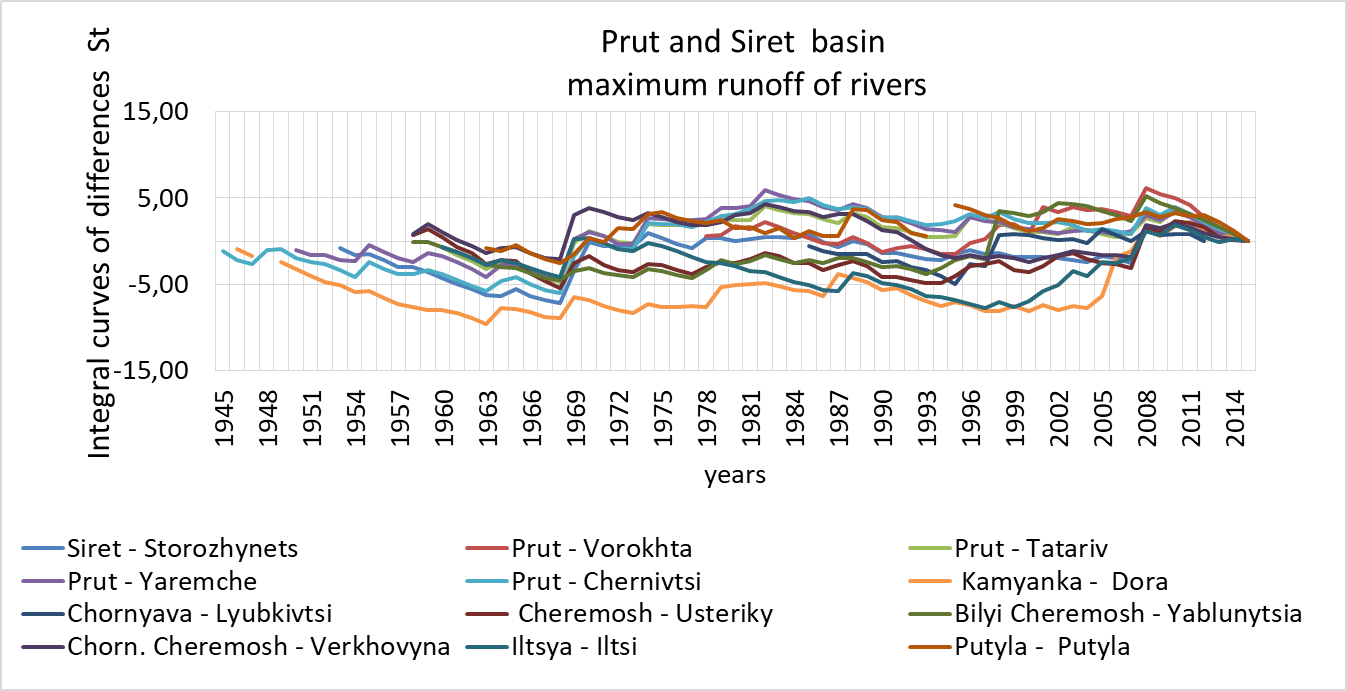
Fig. 5. Integral curves of differences maximum per year runoff of rivers Prut
and Siret basin within Ukraine

Fig. 6. Summary integral curves of differences maximum per year runoff of rivers Tysa,
Prut and Siret basins within Ukraine
Table 5. Generalized data on the duration of cycles in time series of characteristics
of water runoff on the rivers of the Tysa, Prut and Siret basins within Ukraine
by autocorrelation and spectral analysis
River – section | Duration of cycles (number of years) | |||
average annual water runoff | water runoff (warm period) | water runoff (cold period) | maximum per year water runoff | |
Tysa -Vylok | 4, 30 | 3-5 | 6-8 | 7, 14-15 |
Prut - Chernivtsi | 3-5, 7, 14 | 4, 7 | 3-4, 7 29-31 | 5-7, 26 |
Table 6. The closeness of the relationship between time series of water runoff characteristics
of adjacent river basins of the Ukrainian Carpathians Tysa -Vylok↔ Prut – Chernivtsi
River – section | Average annual water discharge | Average water discharge (warm period) | Average water discharge (cold period) | Maximum discharge of water |
Correlation coefficients r | ||||
Tysa-Vylok ↔ Prut- Chernivtsi | 0.62 | 0.72 | 0.46 | 0.05 |
Their analysis showed that cyclic components are present (5-7, 14, 15 and 26 years), in the current period there is a tendency to decrease the maximum (Lukyanets, Kaminska 2015; Lukianets 2017; Lukianets, Obodovskyi 2015). If the connection between the average annual discharges of the Tysa and Prut rivers is rather tight (the correlation coefficient is 0,62), then it is absent for the highs due to the difference in the orography, climatic conditions, and, as a matter of fact, the genesis of floods. Within the basin of the Prut and Siret rivers, particularly intense rainfall is observed in the summer at the time of cold fronts moving from the northwest and north. The Tysa basin is characterized by both rain and mixed floods in the cold period.
CONCLUSIONS
The average maximum runoff of rivers in the observation term in the multi-annual period varies– 17,1-1873 m3·s-1 in the Tysa basin, and 15,7 – 1133 m3·s-1 in the Prut basin. Accordingly, maximum specific discharges runoffs are 90,6 – 1886 and 71,8 – 867 dm3·s-1·km-2. Absolutes instantaneous of the maximum runoff during observation in the Tysa basin recorded on the river Turia – Turia Polyana (F = 98,6 km2) – 6298 dm3·s-1·km-2, in the Prut basin on the river Kamianka – Dora (F = 18,1 km2) – 4790 dm3·s-1·km-2. The coefficients of variation in the Tysa basin are smaller (0,37– 0,89) than in the Prut basin (0,54–1,1). Skewness coefficients have positive values that vary in wide range from 0,2 to 5.
For mountain rivers in the Tysa basin and in the Prut basin the maximums exceed the daily average values by 1,7 – 2,2 times, in the foothills – by 1,3-1,6 times, and with access to the plain – 1,0-1,2 times.
Generalized data on the duration of cycles in time series of characteristics of water runoff on the rivers of the Tysa, Prut and Siret basins within Ukraine by autocorrelation and spectral analysis, showed that there is a periodicity of 5-7, 14, 15 and 26 years in the structure of cyclic oscillations of maximum runoff. The oscillation periods do not coincide in the studied basins. If average annual water runoff of the Tisza and Prut rivers has a strong connection, in maximum runoff it is not recorded. In the current period, there is a tendency to decrease the maximum.
REFERENCES
- Grebin V.V., Lukianets O.I., Аndrela S.P. Character of changes of the water mode and repetition of floods in cold and warm periods of year in river basin of Tisza (within Ukraine). Ukrainian hydrometeorological journal.2013. № 13. P. 147-154. In Ukrainian. [Гребінь В.В., Лук’янець О.І., Андрела С.П. Характер змін режиму водності та повторюваності паводків в холодний і теплий періоди року в басейні Тиси (у межах України). Український гідрометеорологічний журнал. 2013. № 13. С. 147-154.]
- Lukіanets O., Moskalenko S. Generalization and multi-annual variability of the maximum annual runoff river water in accordance with the hydrographic zoning of Ukraine. Hidrolohiiа, hidrokhimiiа i hidroekolohiiа. 2019. № 2 (53). P. 6-20. In Ukrainian. [Лук’янець О.І., Москаленко С.О. Узагальнення та багаторічна мінливість максимального річного стоку води річок відповідно до гідрографічного районування України. Гідрологія, гідрохімія і гідроекологія. 2019. Т. 2 (53). С. 6-20.]
- Lukyanets O.I., Kaminska T.P. Regularities and spatial synchrony of perennial cyclical fluctuations in the water runoff of the Ukrainian Carpathians rivers. Scientific Herald of Chernivtsy University: collection of scientific papers. Chernivtsy: Chernivtsy National University, 2015. Vol. 744-745: Geography. P. 18-24. In Ukrainian. [Лук’янець О.І., Камінська Т.П. Закономірності та просторова синхронність багаторічних циклічних коливань водного стоку річок Українських Карпат. Науковий вісник Чернівецького університету: збірник наукових праць. Чернівці: Чернівецький нац. ун-т.: Географія, 2015. Вип. 744-745 С. 18-24.]
- Olga Lukianets & Iurii Obodovskyi. Spatial, Temporal and Forecast Evaluation of Rivers’ Streamflow of the Drainage Basin of the Upper Tisa under the Conditions of Climate Change. Scientific Journal: ENVIRONMENTAL Research, Engineering and Management, No. 71(1). Kaunas, KTU. 2015. Р. 36-46.
- Olga Lukianets. Stochastic regularities of long-term fluctuation of average annual runoff of rivers of Tisza river basin (within the Ukraine). Electronic Book with full papers from XXVII Conference of Danubian Countries on the hydrological forecasting and hydrological bases of water management. 26-28 September 2017, Golden Sands, Bulgaria. Р. 280-290.