HYDROLOGICAL DROUGHT AND FIRE RELATIONSHIP
Tzviatka Karagiozova, Plamen Ninov
National Institute of Meteorology and Hydrology (NIMH)
Corresponding author: Tzviatka Karagiozova, NIMH, Sofia 1784 Tzarigradsko shosse 66, tzviatka.karagiozova@meteo.bg
ABSTRACT
Drought can be defined in meteorological terms or in relative terms with respect to hydrology and ecosystems. Meteorological drought is not a necessary or a sufficient condition for fire, because fires burn during conditions of normal seasonal aridity. Drought occurs without wildfires in the absence of ignitions. However, when drought occurs, both live and dead fuels can dry out and become more flammable. Hydrologic drought as natural event is the result of long-lasting rainfall in the catchment area leading to the gradual depletion of water resources in the river network and the occurrence of a drought. Typically, hydrological drought is recorded as a river runoff below acceptable critical value.
The authors explore the relationship between hydrological drought and forest fires. They present projections of fire-related drought indicators: the hydrologic indicator 7Q10 (the lowest 7-day average flow that occurs on average once every 10 years). The implementation of the hydrological drought as an approach for fire risk assessment has just started in Bulgaria. For this purpose, the assessment of the feasibility of using the hydrological 7Q10 drought index as a fire hazard indicator in real time is based on archive information on the variation of hydrological characteristics in the river network before and during an actual fire in an accepted pilot catchment.
The Hydrologic Index 7Q10 for the pilot catchment of the Struma River was determined according to the rules for the last 15 years (2003-2017) using the daily water flows from all hydrometric stations
The results of the presented study confirm the possibility of using the hydrological 7Q10 drought index to assess the risk of real-time fires by information on runoff from operational hydrological stations. One of the largest fires in the Struma River in 2017 occurred in an area identified as a fire on a highly hazard area according to the hydrological drought index 7Q10.
Keywords: hydrology, drought, fires, indexes
INTRODUCTION
The historical relationships between drought and wildfire are well documented in many countries, with forest fire occurrence and area clearly increasing in response to drought. There is also evidence that drought interacts with other controls (forest productivity, topography, fire weather, management activities) to affect fire intensity, severity, extent, and frequency (Littell et al. 2006, 2010, 2011, 2016).
Meteorological drought is a period of significant deficiency of rainfalls or even a prolonged lack thereof. This deficiency is closely linked to a number of more factors, such as high temperature and high-speed winds, which inevitably increase the total evaporation. The meteorological drought occurs when rainfall cannot compensate for the physical evaporation and transpiration of plants, and falls below a certain level, depending on climatic and regional characteristics. Meteorological drought analysis refers to monthly and annual time series of rainfall, on the basis of which the corresponding exceeding thresholds (Adler and et al. 2015).
Hydrological drought, characterized by reduced volume of lakes, reduced groundwater levels and reduced river runoff may occur over a period of one or several consecutive years, often affecting large areas. Climate variations are the main natural physical determinant of its degree of manifestation but human activity also influences (Smakhtin, 2001).
Hydrological drought is a rare hydro-climatic phenomenon, with a negative frequency deviation in the amount of water fed by rainfall, compared to the average multiannual value considered as "normal". When hydrological drought occurs, the result of its occurrence is felt in much wider territories in terms of space and time, and usually affects users in the lower parts of the studied river basins. According to many accepted definitions, the spatial and temporal variation of hydrological drought is expressed by the shortage of groundwater and surface water. Hydrological drought can be defined by the following characteristics: absence of rainfall and reduced humidity; the abnormal deficit in reference statistics (average and normal for the climate) and the continued manifestation of this deficit (Adler and et al. 2015).
Meteorological drought is not a necessary or sufficient condition for fire because fires burn during conditions of normal seasonal aridity. Both fire and hydrologic drought occur with some lag after meteorological drought begins. Such relationships could be useful, because fire forecasts based on the same mechanisms could be built from the substantial infrastructure and capacity for forecasting hydrologic drought. Index that can be used to define drought may at least determine the ability to detect mechanisms by which hydrological affects wildfire. The hydrologic indicator 7Q10 (the lowest 7-day average flow that occurs on average once every 10 years) is a fire-related drought indicated invented and implemented in US to predict fires in forest national parks and is based on the water balance deficit in the water system critical for fire occurrence. (Littell et al. 2016).
METHODS AND DATA (STUDY AREA)
According to the definition drought indicator 7Q10 is the lowest average discharge over a period of one week with a recurrence interval of 10 years. Since the value of number of years for the 7Q10 is 10 years, there is only a 10% probability that there will be a lower flow in any given year. There is a 90 % probability that the flow will be greater than the 7Q10 value. The relationships between fire occurrence of wildfires and the above drought indicator related to the water balance deficit and streamflow is proven in many ecosystems is US (Littell et. al. 2006, 2010, 2011, 2016). The drought indicator 7Q10 is implementing in Bulgaria now. The very good result of this indicator appliance, as a fire predictor, is demonstrated in the present material. The indicator was applied and successfully validated during the real and very severe wildfire in Kresna Gorge on 24-29 August 2018.
The drying indicator 7Q10 is a very strict index where the probability of occurrence of wildfire is already a reality. The water deficit in the ecosystem has reached a threshold where the presence of ignition factors and materials that can burn makes the fires an imminent danger. Notwithstanding the usefulness of such an indicator, we also need other drought indicators, which would have warned us earlier about the approach of fire conditions without this danger being necessarily imminent. Such an index is the Standardized Runoff Index (SRI), implemented in the operational practice of the institute. The standardized runoff index is a tool suitable for characterizing hydrological drought relative to a river runoff. It is a standardized assessment of the outflow, allowing its values to be taken outside the normal range. It is similar to the Standardized Precipitation Index (SPI), based on the same basis as the river runoff basis that is appropriate for the river runoff. The index SRI can serve to identify past droughts as well as future droughts. For the diagnosis of the phenomenon drought can be associated with thresholds as follows: extremely wet SRI > 1.65; very wet 1.65 ≥ SRI > 1.28; moderately wet 1.28 ≥ SRI > 0.84; near normal 0.84 ≥ SRI > -0.84; moderate drought -0.84 ≥ SRI > -1.28; severe drought -1.28 ≥ SRI > -1.65 and extreme drought SRI ≤ -1.65. The last one’s values can be used to identify areas of high and very high risk of fires.
The Kresna Gorge is a forest National Park located in the Struma river catchment with a significant Mediterranean climate influence and hot dry summers. The Struma River is among the biggest rivers flowing both in Bulgaria and Greece. The upper and the middle streams are situated on the Bulgarian territory. On the Greek territory, the river Struma inflows into the Mediterranean Sea at open large valley. The watershed area till the boundary is 1097 km2; average altitude is 900 m – Fig.1 a. The climate is a mixture between the European continental and Mediterranean. The climate of the northern part of the basin is of continental type and gradually moves to the Mediterranean type towards the southern part of the catchment area. Annual precipitation amounts vary between 500 mm for the plains and 1200 mm for the high-mountain parts of the catchment area. The monthly precipitation amounts are relatively evenly distributed, with a maximum at the end of spring due to the influence of the continental climate in the northern part and another maximum at the beginning of winter which is more pronounced in the southern part of the catchment area. During the summer heats there are periods with significant droughts. The heats and dry winds flow easily into the area near Kresna Gorge thanks to the topography - a “funnel” open to the sea.
Climatic and topographical features of the area make comparatively frequent forest fires during the hot summer months. Examples of registered fires close to the towns last years were registered by the municipalities and fire protection services. The main parts of registered wildfires are in the middle and lower Bulgarian part of the watershed – Fig.1 b. The map shows only the recent fires because the registration of the wildfires has started only recently. The big fires in past exist only in the human memories. Anyway, the map shows that the fires are not rare events in the Struma region.
National Institute of Meteorology and Hydrology is a State scientific institution responsible for both monitoring, collection and interpretation of the hydrological information in Bulgaria. The total number of gauging stations in the Struma watersheds is 28. The operative stations among them are 11 and all of them automatic. The information from the operative is obtained every day and is available online openly. The non-operative stations are 17; the information is collected less frequently from recorders and is not available online. The usage of non-operative stations during the fire time required additional mobilization and observations. That is possible because these stations have a designated observer who, in extreme conditions (for example fires), can transmit information in real time. Information of the all gauging stations is used in the investigation – Fig. 1 c.
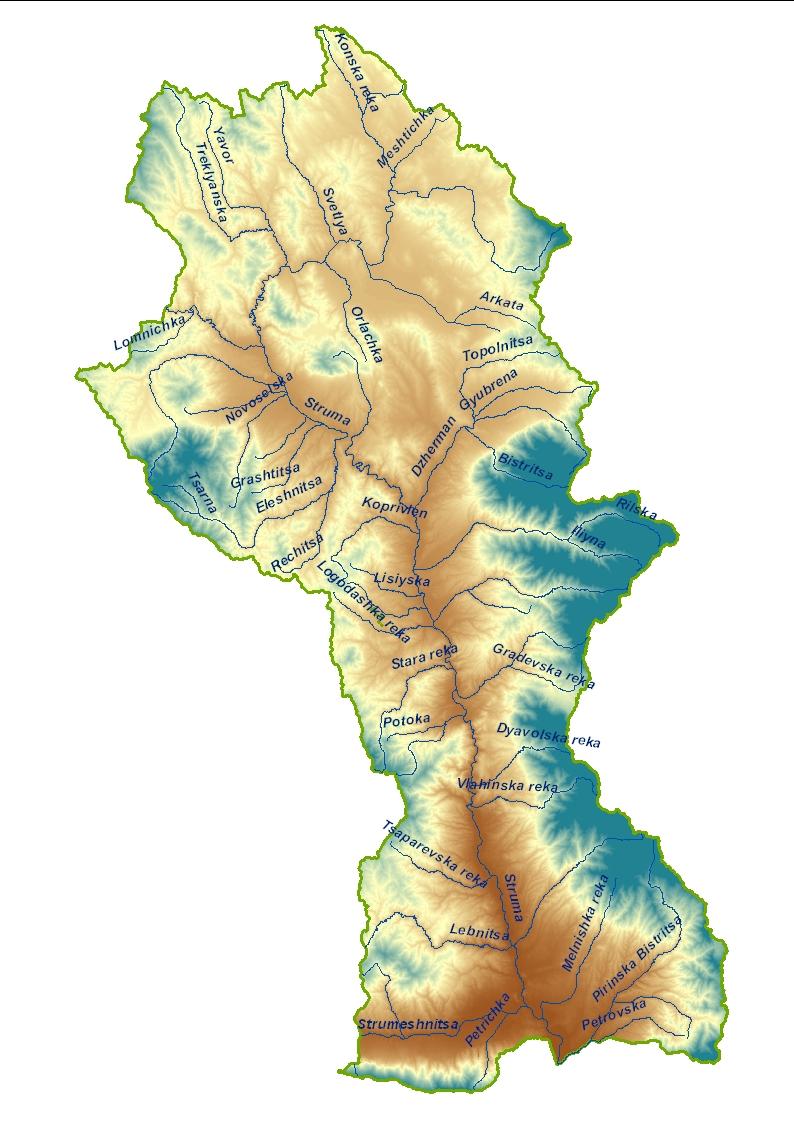
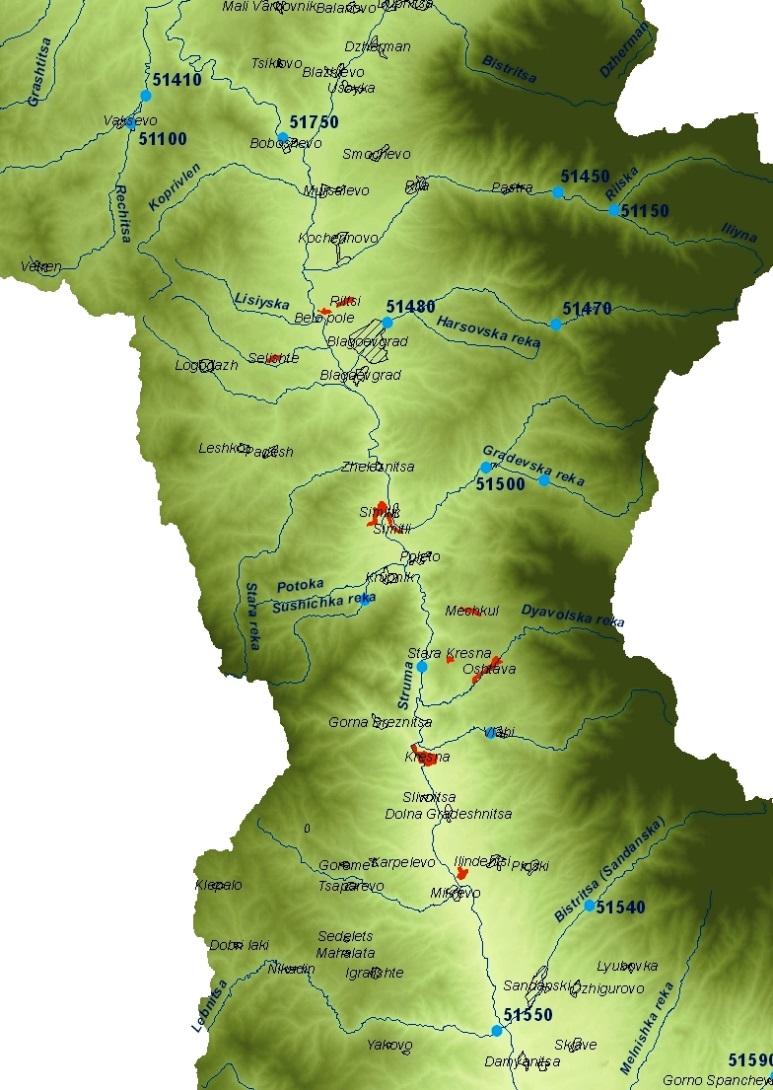
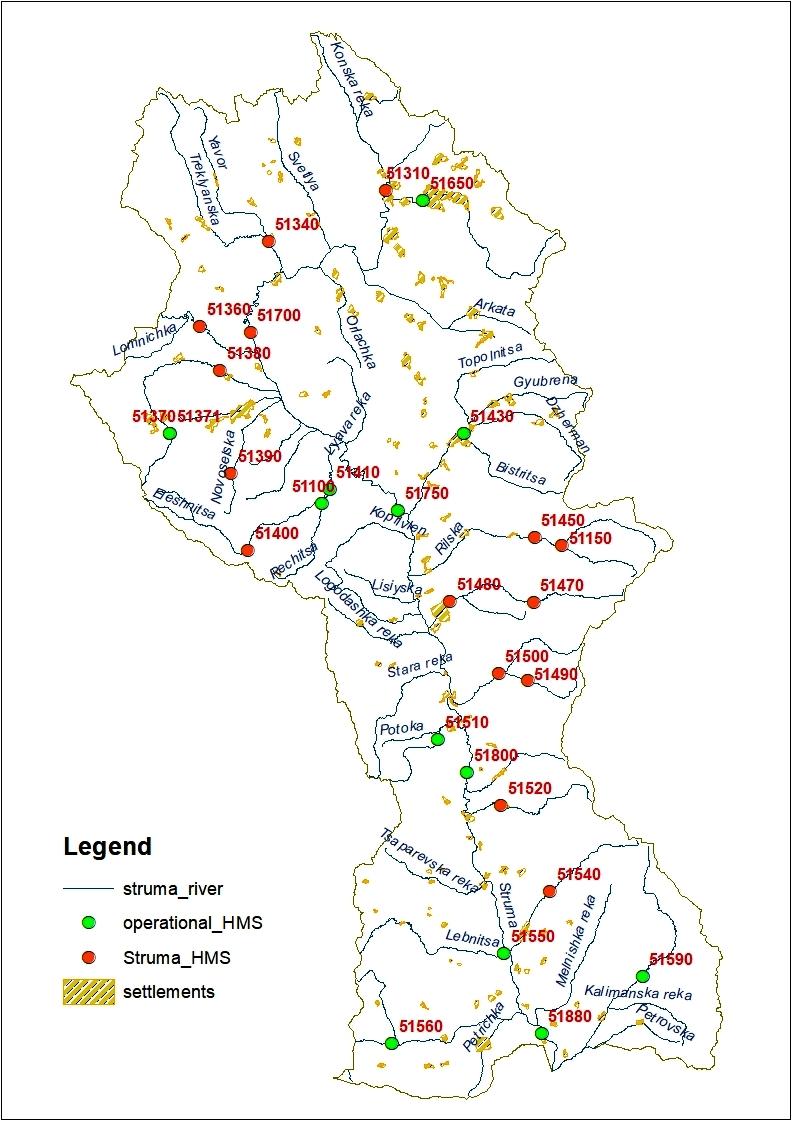
a b c
Fig.1: a – topography map of the Struma watershed (Bulgarian part); b – map of registered fires last years; c – map with gauging stations on the territory of the Struma watershed
The basic idea behind the usage of different drought indicators for fire protection is extremely simple but effective. Having the values of these indicators expressed as water discharge (m3/s) at some gauging station and knowing the corresponding water levels we quickly can assess the risk of fire occurrence in the nearby area. If the values of the passing flows (or their respective water levels) are close to the value of 7Q10 or less then the danger of fire is imminent.
The SRI index can be used only for preliminary assessment of the deteriorating water conditions that could make possible occurrence of fires in the future. However, as part of NIMH operational practice, it can be used successfully without additional activities as a first warning of a looming fire hazard. The NIMH's website periodically publishes monthly maps showing in colors from blue to red different watersheds indicating various drought conditions at the moment. The use of both indicators is discussed below in the case of a real large wildfire at Kresna Gorge.
RESULTS AND DISCUSSION
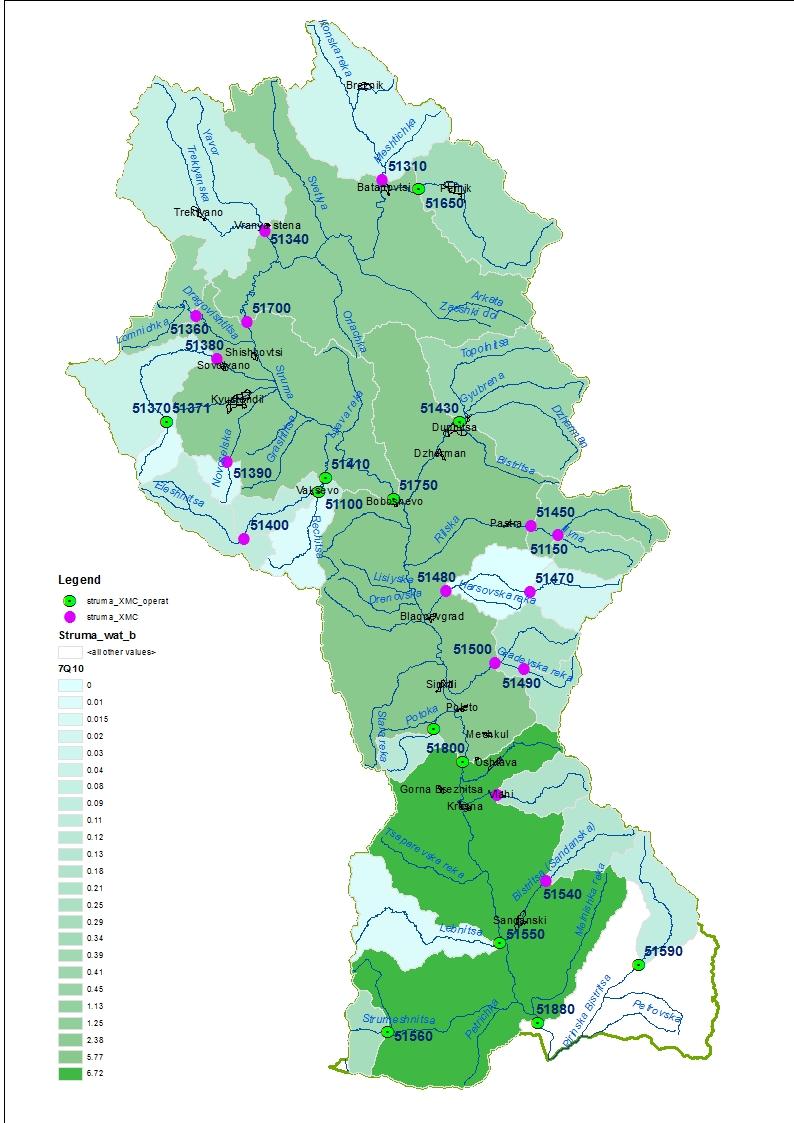
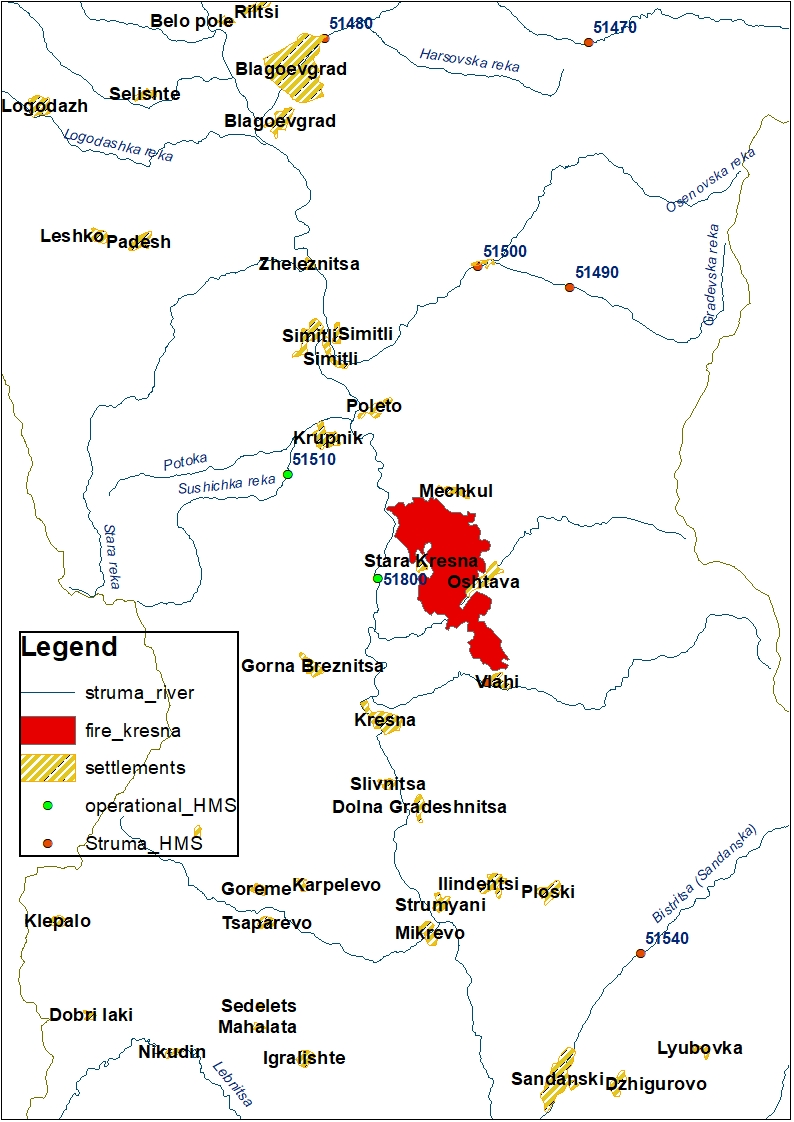
The Hydrologic Index 7Q10 for the pilot catchment of the Struma River was determined according to the rules for the last 15 years (2003-2017) using the daily water flows from all hydrometric stations. The specified index 7Q10 is considered to be the minimum flow runoff value in the rivers below which fire conditions are generated. The values for the hydrological indicator 7Q10 are calculated for all gauging stations in the Struma watershed in (m3/s) and the areas with equal values of this indicator are determined after interpolations. On the Fig. 2 are visualized, using different green colors, the spatial distribution of the indicator 7Q10 and the gauging stations divided into operative and non-operative.
In the period 24-29.08.2017 in the area east of the Kresna Gorge in the valley of the Struma River happened one of the biggest fires for 2017, which affects 16,000 decares. The big fire has spread into forest areas, as well on significant grass and shrub barren areas. The fire occurred in the grassy heathlands south of the Mechkulska River and quickly spread to the south, reaching the villages of Stara Kresna, Oshtava and Vlahi. The protected area in the gorge is also partially affected. On the map below is shown the burned area during the fire with red color - Fig. 3.
Years after the fire broke out near Stara Kresna village the eco-catastrophe over the gorge not completely overcome leaving destroy pine forests and burned houses. Shortly before 2 pm on August 24 a fire broke out. The smoke pillar was visible from Blagoevgrad and Sandanski towns (mote the 40 km), the fire reached Vlachy village, Kresna municipality was extinguished. The headquarters headed by Interior Minister was closed on 29 August. In the fire that passed through the villages of Oshtava and Stara Kresna, 10 houses were burned, two of them inhabited. Fortunately, there were no human casualties. It has been identified as one of the largest eco-catastrophes in the country in the last 20 years. The logging of the burned wood is over recently, only the stumps of the cut pines, as well as the stones cracked by the fire, protrude from the burnt earth. And trees that are not fit for felling, “jutting” out into the sky, as “signposts” to a destroyed and living eco-system.
Fig. 2. The spatial distribution of the indicator 7Q10 | Fig. 3. The burned area during the fire |
The wildfire event in August 2017 lasts six days. For each day between 24 and 28 August are determined the running daily flows at any gauging stations. They are compared to the previously calculated values for the indicator 7Q10 in (m3/s). As result six maps are prepared, day by day, of fire risk zones with running water <7Q10 for where areas in fire risk are colored in light brown and the zone in non-fire risk in blue – Fig. 4. Obviously, the whole area above or close to the fire is in area in fire-risk all the time. The burned fireplace is located just at the end of the risky zone where the risky factors are more concentrated. They are result not only of the local factors as flammable materials but the impact of the whole severe drought above on the water conditions at the fireplace.
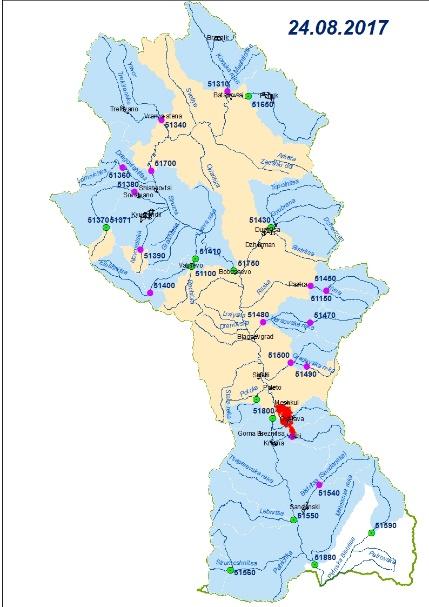
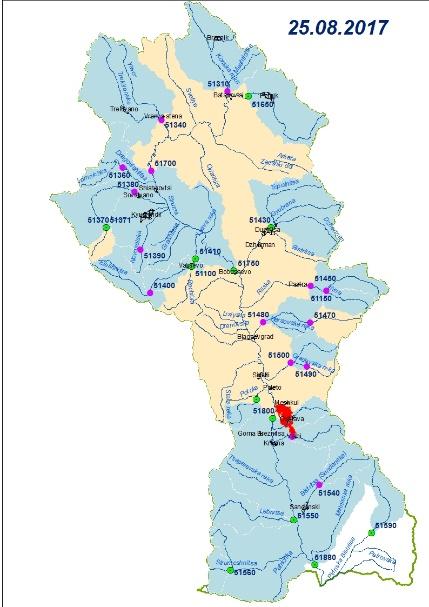


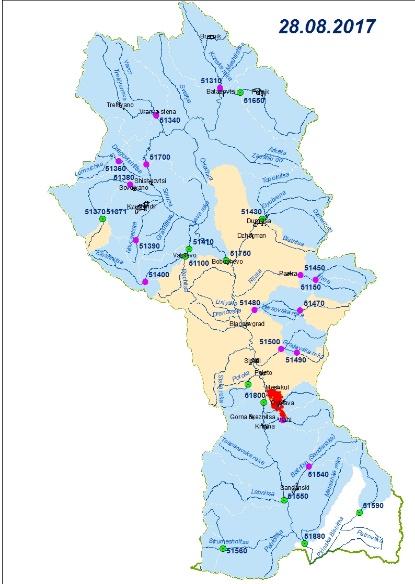
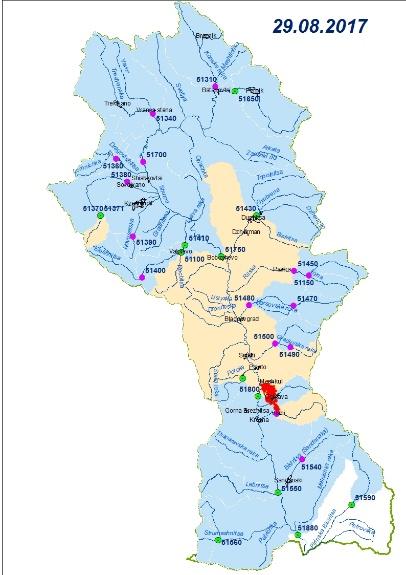
Fig. 4. Risk zones with running water <7Q10 for the period 24-29.2017 (day by day)
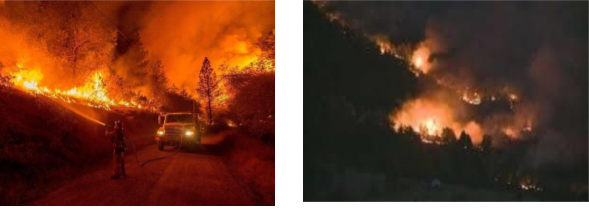
Photos of the Kresna Gorge fire in August 2017
In the area of the wildfire exists a gauging station Kresnensko hanche (N 51800), opened in
1950 and working continuously until nowadays. Comparing calculated 7Q10 and measured flow values during the real demonstrates in a categorical way that daily flows consistently decrease as they approach the moment of fire, but the flows fall below the 7Q10 indicator value entirely around the time of the fire event - Fig. 5. This is indisputable evidence of the relationship between the minimum water quantity and the relevant significant water deficit in the ecosystem determined by the above indicator and the actual risk of fires in the presence of such conditions on land. Some daily flow values at the Kresnensko hanche station compared to the calculated 7Q10 indicator in (m3/s) for the critical period of the fire in August 2017 are shown in the Table 1.
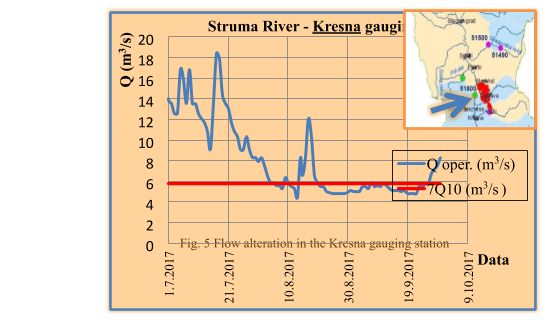
Fig. 5. Juxtaposition of calculated 7Q10 and daily flow values during the real fire
Table 1. Daily flows at the Kresnensko hanche station compared to 7Q10 value in (m3/s)
23.8.2017 | 24.8.2017 | 25.8.2017 | 26.8.2017 | 27.8.2017 | 28.8.2017 | 29.8.2017 | 7Q10 |
Q (m3/s) | Q (m3/s) | Q (m3/s) | Q (m3/s) | Q (m3/s) | Q (m3/s) | Q (m3/s) | Q (m3/s) |
5.05 | 4.90 | 4.80 | 4.80 | 4.80 | 4.80 | 4.80 | 5.77 |
The results of the presented study confirm the possibility of using the hydrological 7Q10 drought index to assess the risk of real-time fires by information on runoff from operational hydrological stations. One of the largest fires in the Struma River in 2017 occurred in an area identifies as a fire highly hazard area according to the hydrological drought index 7Q10.
The indicator 7Q10 surely defines imperatively the real fire risk. But we need some other more indexes (or characteristic flows) which will extend the boundary for the preliminary warning for fires. We need not just a red warning flash where the danger is immediate or even factual. We need a less severe drought indicator to sharpen our attention before the risk of fires is so great. The above-mentioned Standardized Runoff Index (SRI) is suitable for these purposes. There are many indices relevant to drought assessment. The Standardized Runoff Index has the advantage of being widely known, comparable and easy to calculate. It expresses the standardized assessment of the dispersion of the outflow relative to the mean over a period of time (McKee et al., 1993, Shukla, Wood, 2008). The index calculation is performed on the basis of river outflow data transformed by standard normal distribution over a specified time step.
Available and reliable information is available to determine this indicator. However, it must be emphasized that SRI is not directly related to fires and the conditions for their occurrence but to the overall conditions of the drought. Its use for the purpose of forecasting and fire alarm to the relevant services and/or population is unjustified. The index SRI can serve professionals and scientists in their operational practice as a preliminary indicator.
Different durations (e.g., 1-month, 9-month) and different spatial aggregations of the index can be calculated depending on source data resolution and desired application. Definition of new severity thresholds based on the probability of exceeding an observed runoff value, which will have an associated SRI value. These values, quoted above, determine the different drought conditions following: extreme drought - runoff value exceeded 95 % of the time, corresponds to SRI = - 1.65, severe drought - runoff value exceeded 90 % of the time, corresponds to SRI = - 1.28, mild drought runoff value exceeded 80 % of the time, corresponds to SRI = - 0.84. On the Table 2 “Standardized Runoff Index for Struma basin 2017” in different colors from red till yellow are indicated the different stages of drought condition at different gauging stations and their adjacent areas month by month. The light or deep green and blue colors indicate the different wet conditions according to the same index. Obviously where the color is red at this station and in this month the drought conditions are worsening and we must keep in mind the reduced water content in the ecosystem and the already registered water deficit. This deterioration of water resources and water scarcity is not yet a sufficient cause for fire alarms, but it is a cause for caution.
The Table 2 is very indicative with its color images for the period during which fires can be expected. Although it is only for one-year demonstration - the year of the fire study 2017, it is extremely clear to see the summer months in which this phenomenon can be expected in the Struma watershed, as well as the periods where the probability is insignificant. However, the high-water content in the springtime almost eliminates the possibility of wildfires. A multiannual analysis may also outline the most endangered areas around gauging stations with higher wildfire probability from hydrological point of view.
Table 2. Standardized Runoff Index for Struma basin 2017 for all hydrometric stations
Year | Struma River – HMS | ||||||||||||||||||||||||||
1 | 4 | 3 | 4 | 2 | 4 | 3 | 4 | 3 | 3 | 3 | 4 | 4 | 4 | 3 | 3 | 3 | 3 | 4 | 3 | 3 | 4 | 4 | 4 | 4 | 3 | 3 | 3 |
2 | 5 | 4 | 4 | 4 | 4 | 2 | 4 | 4 | 4 | 4 | 4 | 4 | 4 | 3 | 3 | 4 | 4 | 4 | 4 | 2 | 4 | 4 | 4 | 4 | 4 | 4 | 4 |
3 | 4 | 4 | 4 | 4 | 4 | 4 | 4 | 4 | 4 | 4 | 4 | 4 | 4 | 4 | 4 | 4 | 4 | 4 | 5 | 4 | 4 | 5 | 4 | 4 | 4 | 4 | 4 |
4 | 4 | 4 | 4 | 4 | 4 | 4 | 4 | 4 | 4 | 4 | 4 | 4 | 4 | 4 | 4 | 4 | 4 | 4 | 4 | 4 | 4 | 4 | 4 | 4 | 4 | 4 | 4 |
5 | 4 | 4 | 4 | 4 | 4 | 4 | 4 | 4 | 4 | 4 | 4 | 4 | 5 | 5 | 7 | 6 | 6 | 4 | 5 | 6 | 4 | 4 | 5 | 4 | 4 | 4 | 4 |
6 | 4 | 4 | 4 | 4 | 4 | 4 | 4 | 4 | 4 | 4 | 4 | 4 | 5 | 4 | 4 | 4 | 4 | 4 | 4 | 4 | 4 | 4 | 4 | 4 | 4 | 4 | 4 |
7 | 3 | 4 | 4 | 3 | 4 | 2 | 3 | 4 | 2 | 4 | 4 | 3 | 4 | 4 | 4 | 4 | 4 | 2 | 3 | 4 | 4 | 3 | 3 | 3 | 3 | 3 | 2 |
8 | 2 | 3 | 3 | 3 | 2 | 2 | 2 | 2 | 1 | 2 | 2 | 2 | 3 | 4 | 4 | 2 | 1 | 1 | 2 | 3 | 3 | 3 | 4 | 3 | 1 | 2 | 1 |
9 | 2 | 3 | 3 | 4 | 2 | 2 | 2 | 2 | 1 | 2 | 3 | 2 | 3 | 4 | 3 | 1 | 1 | 2 | 3 | 3 | 4 | 3 | 2 | 3 | 2 | 2 | 1 |
10 | 3 | 3 | 3 | 3 | 3 | 2 | 2 | 3 | 2 | 3 | 3 | 2 | 4 | 4 | 3 | 3 | 3 | 3 | 4 | 4 | 4 | 4 | 3 | 3 | 3 | 2 | 2 |
11 | 4 | 3 | 3 | 4 | 4 | 4 | 2 | 3 | 3 | 3 | 4 | 4 | 4 | 4 | 3 | 4 | 4 | 3 | 4 | 4 | 4 | 4 | 3 | 3 | 3 | 3 | 4 |
12 | 5 | 4 | 4 | 7 | 7 | 5 | 4 | 7 | 6 | 4 | 4 | 4 | 5 | 4 | 4 | 4 | 4 | 4 | 4 | 5 | 7 | 6 | 6 | 5 | 5 | 4 | 4 |


Finally, back to the fire in August 2017. On the maps below Fig. 6 – there is a very clear and simple visualization of the positive warning effect using the Standardized Runoff Index (SRI). On the maps the two neighboring watersheds - Struma and Mesta (smaller one) are presented. The assessment using indicator SRI is very rough been calculated and spread all over the whole watersheds. But any way in July we have assessed a severe drought in the Struma watershed (in orange warning color on the map) and wet conditions in the near Mesta catchment. In August we have already extreme drought in the Struma watershed (in red warning color on the map) and real wildfire events. At the same time the conditions in the Mesta catchment are only worsening (in yellow) been away from risky fire conditions and without any fire registered in this month.
Drought is a natural event that, unlike floods, does not occur in a sudden burst but gradually happens. This length of the process allows sufficient time before the conditions for fires to be prepared for such possible development using more general drought indexes as the Standardized Runoff Index. Reporting of extreme drought in an area, of course, does not necessarily imply the occurrence of fires when the water conditions deteriorate additionally. But a warning of such potential danger is certainly useful. In Bulgaria there is not experience in the usage of hydrological approaches and indices for wildfire predictions but only for meteorological ones. But the link between wildfires and the water deficit in the river basins is obvious and that attitude will alter.
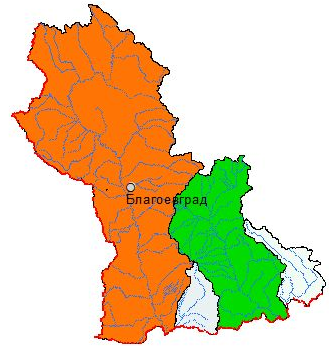
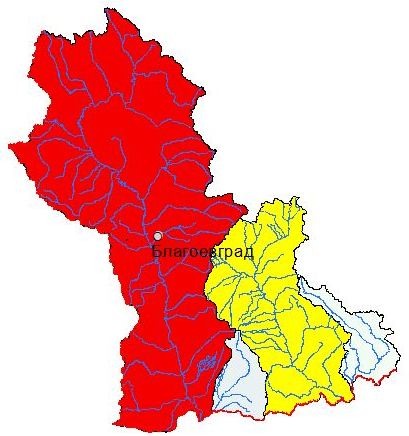
Fig. 6. The Standardized Runoff Index for Struma basin compare to the nearby Mesta basin - July (left map) and August (right map) 2017
The observed and expected impacts of climate change indicate the increase in the observed annual temperature and decrease in precipitation over the territory of the country the coming decades. Such development is unfavorable in terms of the frequency and magnitude of extreme droughts in the future and their relation to fires. This additionally makes the issue of fire prediction and preventive measures even more relevant, including the use of various approaches such as the hydrological drought indicators.
CONCLUSIONS
Combating extreme droughts and the resulting wildfires has always been a problem in Bulgaria with serious economic consequences. There are numerous meteorological indicators that take into account droughts and their relation to fires. However, there are only few hydrological indicators determining the risk of fires provided that the hydrological drought determines conditions suitable for this phenomenon.
The presented material deals with hydrological indicators assessing droughts and the relationship with fires as a means of forecasting. Particular attention is paid to the indicator 7Q10 which quality as a fire predictor is demonstrated, by the example of a real fire in Bulgaria. The use of hydrological indicators is applied for the first time to assess wildfire risks in Bulgaria. Further verification of the indicators is considered at other parts on the territory of Bulgaria and consequently implementation of this approach into the operational activities of the National Institute of Meteorology and Hydrology. From the operational point of view minimal additional organizational work is required. Hydro-observers are appointed in all hydrometric stations in Bulgaria. It is sufficient, when a critical water level corresponding to a water flow Q10 is approaching or reaching, the observer to inform the operational hydrologists in the institute. That is a reason for wildfire warning in the area around the gauging station.
REFERENCES
Keeley JE, Syphard A.D Different fire–climate relationships on forested and non-forested landscapes in the Sierra Nevada Ecoregion. International Journal of Wildland Fire, 2015. Vol. 24, P. 2736.
Littell JS Climate impacts to forest ecosystem processes: Douglas-fir growth in north-western US mountain landscapes and area burned by wildfire in western US eco-provinces. PhD dissertation. University of Washington, Seattle, Seattle, WA, 2006.
Littell J.S., Gwozdz R. Climatic water balance and regional fire years in the Pacific Northwest, USA: linking regional climate and fire at landscape scales. Chapter 5. In: The Landscape Ecology of Fire, Ecological Studies 213 (eds McKenzie D, Miller CM, Falk DA), P. 117-139. Springer, Dordrecht, The Netherlands.
Littell J.S., McKenzie D., Peterson D.L., Westerling A.L. Climate and wildfire area burned in western US ecoprovinces. 2009. P. 1916-2003.
Ecological Applications, 2011. Vol. 19. P. 1003–1021.
Littell J.S., Oneil E.E., McKenzie D., Hicke J.A., Lutz J.A., Norheim R.A., Elsner M.M. Forest ecosystems, disturbance, and climatic change in Washington State, USA. Climatic Change. 2010. Vol. 102. P. 129–158.
Littell J.S., Elsner M.M., Mauger G.S., Lutz E.R., Hamlet A.F., Salathe E.P. Regional climate and hydrologic change in the northern US Rockies and Pacific Northwest: internally consistent projections of future climate for resource management. Final project report, USFS JVA 09-JV-11015600-039. University of Washington, Climate Impacts Group, Seattle, WA., 2011.
Littell J.S, David Peterson, Karin Riley, Yongquiang Liu, Charles h. Luc Aa review of the relationships between drought and forest fire in the United States, Global Change Biology. doi: 10.1111/gcb.13275, 2016, 2016
Smakhtin, V. U. Low Flow Hydrology: A Review. Journal of Hydrology. 2001. Vol. 240. P. 147-186.
McKee, T.B., N.J. Doesken, J. Kleist. The relationship of drought frequency and duration to time scales. Preprints: – In: Eight Conf. on Applied Climatology, Anaheim, CA, Amer. Meteor. Soc., 1993. P. 170-184.
Shukla, S., Wood A.W. Use of a Standardized runoff index for characterizing hydrologic drought. – Geophysical Research Letters 35, L02405. doi: 10.1029/2007 GLO32487, 2008
Alan Gustard and Siegfried Demuth, World Meteorological Organization, WMO – N 1029 Operational Hydrology Report N 50, Manual on Low-flow Estimation and Prediction, German National Committee for the International Hydrological Programme (IHP) of UNESCO and the Hydrology and Water Resources Programme (HWRP) of WMO Koblenz 2009.
Mary-Jeanne Adler, Aleksandrov V. Low flow management Guidelines for the prevention of drought in the flood plain of the Danube River, Project report of EU program Bulgaria-Romania “Danube Water Integrated Management”. 2015.
United Nations Development Programme (UNDP), Capacity Development. Technical Advisory Paper 2. NDP, New York, United States., 1997.
World Water Assessment Programme, Water, a shared responsibility. The United Nations World Water Development Report 2, UNESCO, Paris, and Berghahn Books, New York, United States, 2006.
Van Hofwegen P.J.M., 2004: Capacity-building for water and irrigation sector management with application in Indonesia. In: Capacity Building in Irrigation and Drainage Issues and the Way Ahead. FAO Water Reports, 26, Rome, Italy.