ESTIMATION OF THE T-YEAR SPECIFIC DISCHARGE
USING THE REGIONALISED SKEWNESS COEFFICIENT
OF THE LOG-PEARSON TYPE III DISTRIBUTION
Jakub Mészáros, Pavol Miklánek, Pavla Pekárová
Institute of Hydrology, Slovak Academy of Sciences
Corresponding author: RNDr. Jakub Mészáros, Institute of Hydrology, Slovak Academy of Sciences,
Dúbravská cesta 9, 841 04 Bratislava, jakubmeszaros@uh.savba.sk
ABSTRACT
In this paper the results are presented of estimation of T-year specific discharge of several streams in two regions in Slovakia. The Qmax time series used in the study were observed at water gauges from lowland Slovak part of the Morava River basin, and from the mountainous Belá River basin. For estimating the design values, we have studied the use of only one type of probability distribution, namely the Log-Pearson Type III Distribution (LP3 distribution). The use of only one type of distribution brings several benefits, e.g. possibility of the regionalization of the distribution parameters (in this study skew coefficient). In the first step the design values of the specific discharge series qmax (with historical data) were estimated and regional skew coefficients Gr of the LP3 distribution were computed. Regional skewness coefficient Gr was estimated to be 0.38 in the Morava River region, and 0.73 in the Belá River region. In many cases the estimate of the 1000-year specific discharge is two times higher than the value of the 100-year specific discharge. Then we have derived the empirical relations between station skew coefficient G and the elevation of the water gauge. In the second step we have derived the empirical relationships between 1000-years specific discharge q1000 and the elevation of the water gauge for both regions separately. The derived empirical regional equations can be used to estimate the 1000-years specific discharge of other streams in the region.
Keywords: floods, Log-Pearson Type III Distribution, Morava River basin, Bela River basin
INTRODUCTION
Many human settlements in the world are located on the banks of rivers. Slovakia is no exception. It is necessary to build up the settlements in such way that they are protected against the floods. Therefore, it is of high importance to know the possible magnitude of the floods and the frequency of their occurrence. The motivation of this study was the need to re-estimate and update the flood risk management plans according the EU Flood Directive (EP, 2007). The processing of the hydrological materials needed for creation of the flood risk maps is facing the basic problem that the unified system of flood maps is not approved within the EU countries. Even the primary estimation of 100-, 200-, 500- and 1000-year design values differs in individual EU countries and worldwide.
In former Czechoslovakia the water management had a long history and it was on high level. The first statistically based estimations of 100-year design values were systematically processed for the Slovak rivers in the first half of the 20th century. The assessment of the T-year discharges and their consequent regionalization was done by Dub in 1940 (Kohnová and Szolgay, 1995, 1996). Similar estimation of T-year discharges for the whole territory of Czechoslovakia (250 gauging stations, out of them 75 in Slovakia) was published in 1970 in HMÚ (1970). The binomic and log-normal distribution was applied to estimate T-year discharges according to guidelines prepared by Sochorec (1966). After the floods in 1972 and 1974 the design discharges were re-estimated within the research project of the Slovak Hydrometeorological Institute (SHMI) „Recurrence of the maximum discharges of the Slovak rivers“ (1977 and 1989). Later on, the team of authors from SHMI prepared the guidelines and estimated the T-year maximum discharges within the research project „Assessment of hydrological characteristics – T-year maximum flows“ (Šipikalová et al., 2006). According to Sectorial technical standard of the Ministry of Environment of the SR (MŽP, 2003) the processing of the T-year maximum flows in the gauging stations is based on data series of the maximum annual peak flows (one datum per year). The design flows are as a rule assessed for T = 1, 2, 5, 10, 20, 50, 100-year. The Sectorial technical standard (MŽP, 2003) is not dealing with estimation of the 200-, 500-, up to 1000-year flows.
The estimation of the floods with return periods of 200 up to 1000 years is very complicated task. The available data series are usually less than 100 years long. It is possible to extrapolate such series for 200 up to 1000 years periods by several approaches (statistical methods, rainfall-runoff models, etc.) and it always depends on the experience and knowledge of the expert which method he will decide to assess the T-year flows (Kohnová and Szolgay, 2003; Stanescu, 2004; Kohnová et al., 2006a, b; 2016; Šipikalová et al., 2006; Pekár et al., 2012; Pekárová et al., 2013; Gaál et al., 2010a, b; Merz and Blöschl, 2008a, b; Dysarz, 2019).
The aim of this study is to test one of the different methods of statistical processing of design flow values. Specifically, it is the method based on statistical processing of measured data series of the maximum annual peak discharges, during which the skewness coefficient of the Log-Pearson Type III Distribution is regionalized. The method is tested in two river basins in Slovakia with different physical-geographical characteristics (Fig. 1). The Morava River basin is mostly in lowland and hilly area. The Belá River basin includes high and middle mountain rivers (Fig. 2).
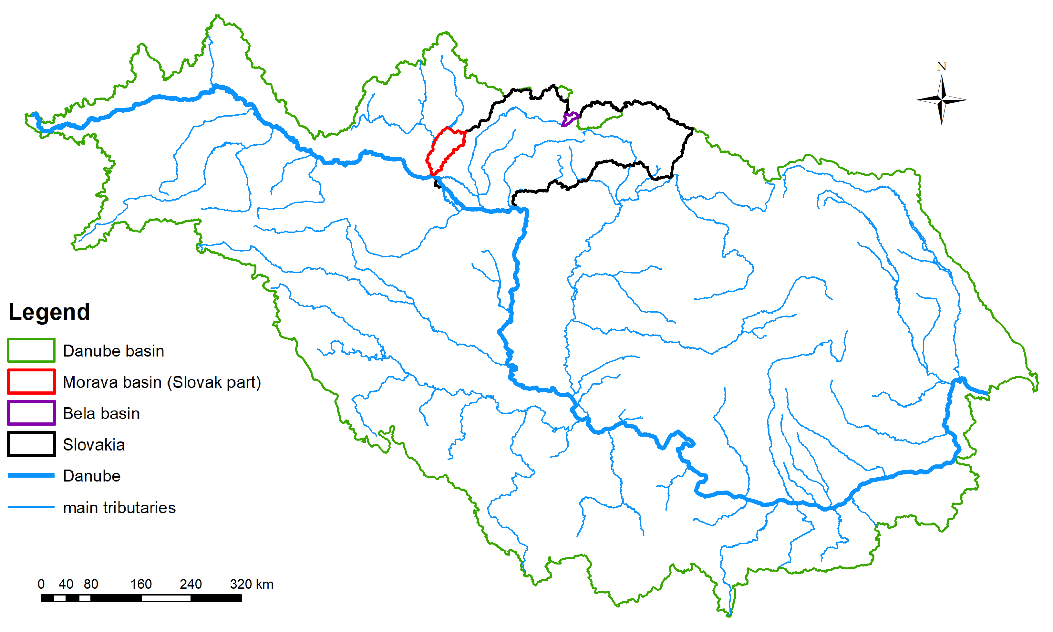
Fig. 1. Situation of study area in the Danube River basin
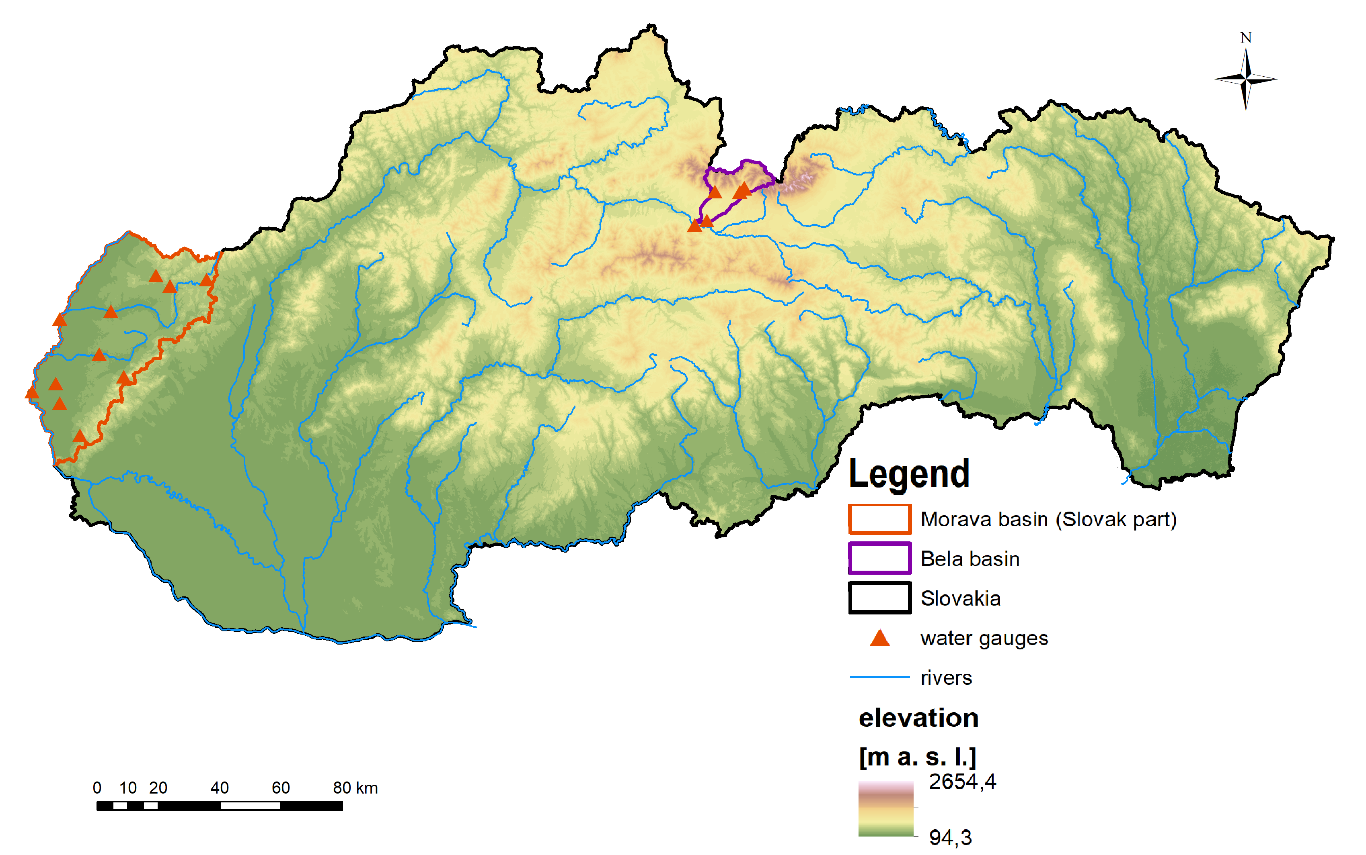
Fig. 2. Location of study basins in Slovakia with terrain
METHODS
According to the Sectorial technical standard (MŽP, 2003) the T-year maximum flows assessment in gauging stations proceeds from the series of maximum annual discharges (one datum per water year, when the water year starts on November 1 and terminates on October 31 of the next year in Slovakia). The design flows are as a rule assessed for T = 1, 2, 5, 10, 20, 50, 100-year. They are expressed in m3.s-1.
The basic procedures of the statistical processing of the T-year discharges are as follows:
1) Selection of discharge time series:
a) series of maximum annual peak discharges Qmax, or
b) series of flood wave peak discharges over certain threshold.
2) Statistical processing of selected discharge series to assess the empirical values.
Various data distribution types are used in hydrology to estimate the distribution functions of maximum annual discharges. In practice, several types of distribution are applied at the same time to estimate the T-year values and the different results help to estimate the uncertainty intervals. The overview of the methods used to assess the design flows in selected countries worldwide was elaborated by Kohnová et al. (2006b).
According to the Sectorial technical standard (MŽP, 2003) following types of theoretical distribution are used in Slovakia to estimate T-year flows in the gauging stations:
• Pearson distribution (Gama distribution) P3,
• Logarithmic-normal distribution LN3,
• Logarithmic-Pearson distribution of the type III LP3,
But the application of other distribution functions is not ruled out.
Our invention was to supplement the series of maximum annual discharge by the data of the historical floods to improve the estimation of the extreme design flows with longer return periods (up to 1000 years). As it was mentioned, the Slovak Sectorial standard does not deal with estimation of the 200-, 500-, up to 1000-year flows, and leaves it on the authors to select the method of estimation of the 1000-year flows.
In this study we proceed according the methodology described in Bulletin 17B issued in 1981 in USA and modified by the Centre of water resources research of the Texas University at Austin (IACWD, 1982). According to these guidelines we are testing LP3 distribution used to estimate extremes in various natural processes and belongs to the most widely used theoretical distributions in hydrology. Procedures how to estimate parameters of the LP3 distribution are described in IACWD, (1982).
There exists quite significant uncertainty when estimating the skewness coefficient (third momentum) G from single gauging station data. In case of series with short observation period this momentum is particularly sensitive to extreme events. In order to achieve better estimation of this coefficient for the river basin it is possible to combine the skewness coefficient calculated for one gauging station G with the regional coefficient Gr to estimate the weighted coefficient Gw. If we assume that the regional skewness coefficient Gr is independent on station skewness coefficient G, it is possible to use the mean square error (MSE) of the skewness coefficient G and of the regional skewness coefficient Gr to estimate the weighted skewness coefficient. If the difference between the regional skewness coefficient Gr and the skewness coefficient G is more than 0.5, it is necessary to check carefully the input data and flood characteristics of the basin. Depending on length of the data series more weight can be given to the station coefficient G. Big differences between regional coefficients and station coefficients can indicate, that the characteristics in the station differ from characteristics of the region (Pekárová et al. 2018).
DATA
We were processing the series of maximum annual discharges of the individual water years in selected water gauging stations in the Slovak part of the Morava River basin and in the Belá River basin (Table 1.). The length of the series was various. The longest series are in station Morava: Moravský Svätý Ján (1895–2017), Belá: Podbanské (1928–2017) and Myjava: Šaštín-Stráže (1932–2017). Some series (Tichý and Kôprovský potok) were intermittent. If the discharge records of historical floods were available, they were added to the series (e.g. Belá River flood in 1813, Fig. 3).
Table 1. List of selected gauging stations with data on gauge zero datum, basin area and inception
of the discharge monitoring
ID | Water gauge | Stream | Elevation [m a. s. l.] | Catchement area [km2] | Discharge since |
5010 | Lopašov | Chvojnica | 272.7 | 31.13 | 1969 |
5025 | Sobotište | Teplica | 236.29 | 85.58 | 1974 |
5020 | Myjava | Myjava | 324.34 | 32.02 | 1974 |
5030 | Šaštín-Stráže | Myjava | 164.25 | 644.89 | 1932 |
5060 | Sološnica | Sološnický p. | 245.35 | 10.338 | 1971 |
5070 | Studienka | Rudava | 170.82 | 280.32 | 1971 |
5095 | Jakubov | Malina | 144.71 | 171.46 | 1964 |
5100 | Láb | Močiarka | 144.33 | 47.1 | 1961 |
5120 | Borinka | Stupávka | 217.2 | 33.76 | 1974 |
5040 | Moravský Svätý Ján | Morava | 146.24 | 24129.3 | 1895 |
5085 | Záhorská Ves | Morava | 139.86 | 25521.3 | 1976 |
5400 | Podbanské | Belá | 922.72 | 93.49 | 1928 |
5390 | Kôprová dolina | Kôprovský p. | 989.6 | 31.24 | 1940 |
5380 | Tichá dolina | Tichý p. | 978.8 | 57.45 | 1940 |
5460 | Račkova dolina | Račkov p. | 894.41 | 35.51 | 1963 |
5465 | Dovalovo | Dovalovec | 627.02 | 21.68 | 1980 |
5480 | Liptovský Hrádok | Belá | 630.44 | 244.26 | 1965 |
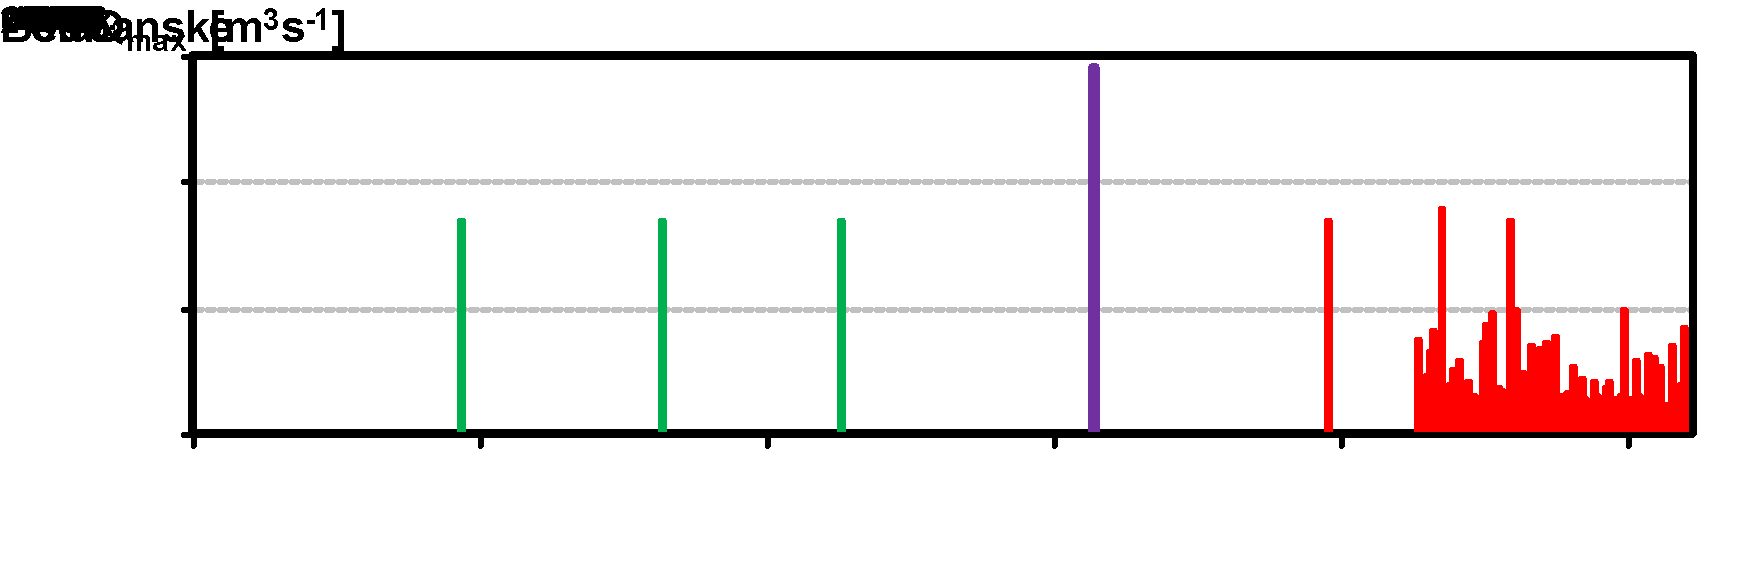
Fig. 3. Maximum annual discharges of the Belá river at station Podbanské during the period (1928–August 2018) (red color) and occurrence of the historical floods (green color)
STUDY AREA
The Morava basin
The Slovak part of the Morava River basin has the area of 2282 km2 and is situated in the most western part of Slovakia near borders to Czechia and Austria. It is bordered with the Morava River in the west. The northern border of the basin is identical with the state border with Czechia and from the village of Rohatec it continues along the Sudoměřický creek to the White Carpathians mountain ridge. From the peak of Čupec (816 m n. m.) the border turns to south along the Small Carpathians ridge. The southern border forms the water divide with the Danube River basin.
From the geomorphological point of view is the Slovak part of the basin situated on divide of the two main orographic units of the Western Carpathians and of the Western Pannonian basin. The area is mostly lowland, as almost 77.4% of the area is below 300 m a.s.l. The highest point is in the White Carpathians geomorphologic unit in elevation of 816 m a.s.l. and the lowest point is the confluence of the Morava River and the Danube River in elevation of 106 m a.s.l. (Fig. 4).
The lowland part of the basin is covered by fluvial and eolic sediments. The Small Carpathians Mountains are geologically complex with clays, sandstones, granodiorite, amphibolite and limestones. The forest covers about 38 % of the area (863.82 km2) with oak, beech, pine and floodplain forest. Most of the area is agriculturally used.
The area belongs to warm and mild warm climatic area. The mean annual air temperature is about 9oC and it is decreasing with elevation. Mean air temperature of January is from -2.0oC in lowland below -3.2oC in the valleys of the hills. The warmest month of July has the mean temperature between 18 to 20oC. The long-term precipitation depth is about 700 mm per year.
The minimum discharge occurs mainly in August and September, when the evaporation is the highest and the maximum discharges occur in February-March due to snowmelt. The length of the main Morava channel is 114 km in the Slovak part (329 km total length). The significant tributaries on the Slovak territory are Myjava, Rudava and Malina (MŽP, 2015).
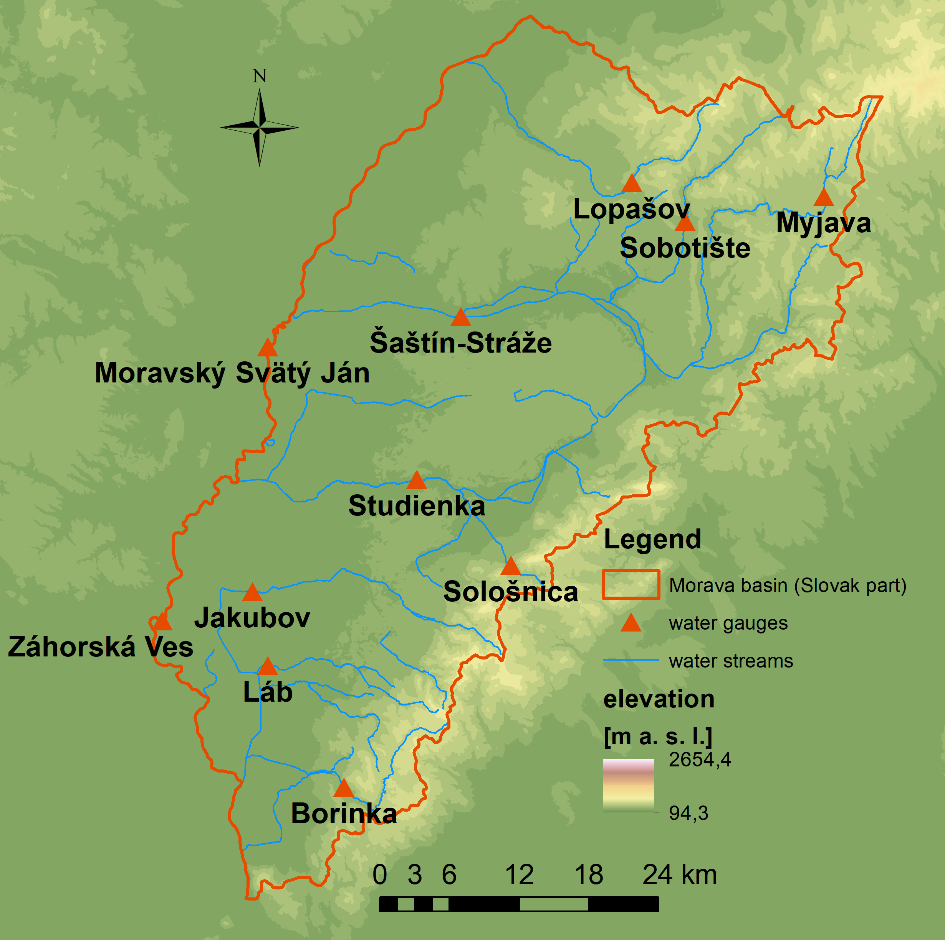
Fig. 4. Terrain in Slovak part of the Morava River basin and used water gauges
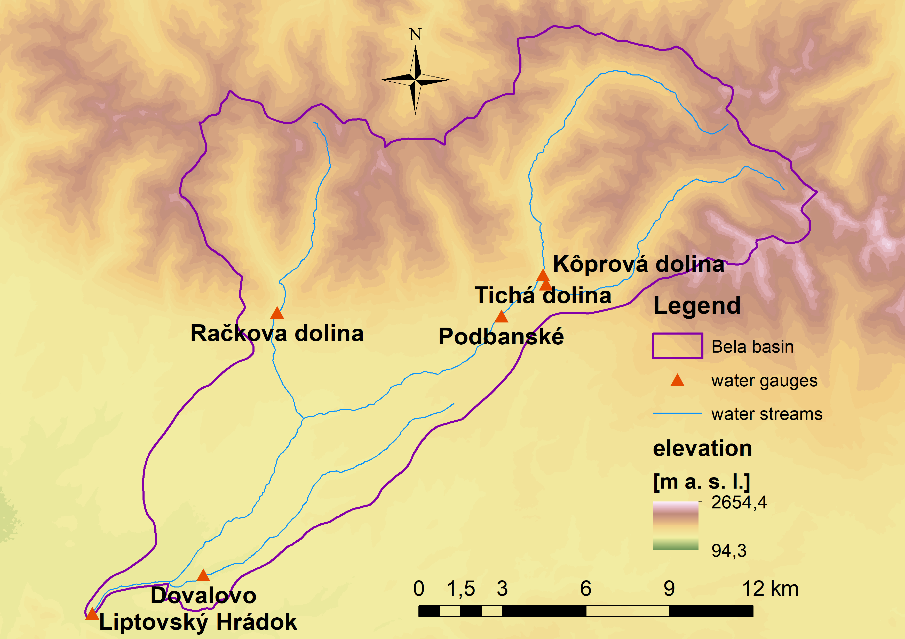
Fig. 5. Terrain in the Belá River basin and used water gauges
The Belá basin
The major stream is the Belá River draining the border area between the Western and Eastern Tatras. It represents the runoff conditions of the highest parts of the Carpathians. The river channel training measures are very limited and the river is meandering and changing its channel after big floods. It originates at the confluence of the Tichý and Kôprovský streams in the elevation of 976.8 m a.s.l. (Pacl, 1959). The confluence with the river Váh is in elevation of 629 m a.s.l. (Fig. 5). The length of the stream is 23.6 km, the basin area to Podbanské is 93.46 km2 and to the Liptovský Hrádok gauge 244.26 km2 (Hlubocký, 1974). The mountainous part of the basin is covered by dwarf pine, spruce and meadows and the lower part is agriculturally used.
The climate is continental and influenced by steep slopes and increase of the elevation. It belongs to cold climate zone. The mean annual air temperature in 1931—2000 was in Podbanské 4.8 °C, at Kasprowy peak -0.8°C. The annual precipitation regime is single peak one with minimum in winter (February) and maximum in summer (June to July). The precipitation depth increases with elevation. The annual precipitation depth is between 900 mm at Podbanské to 1800 mm at Kasprowy peak, out of it 500 mm to 1000 mm during summer. Number of days with snowfall is between 57 and 180 days, and the snow cover lasts 120–200 days (Pekárová et al., 2009a).
The Belá basin was included into the international category of „representative basins“ and it was listed in the framework of the International hydrological program of UNESCO (Hlubocký, 1974). Hydrological regime of the Belá River was studied by Pacl (1951, 1959, 1977) or by Pekárová et al. (2009a-b, 2010).
RESULTS AND DISCUSSION
We have used measured data series of maximum annual discharges Qmax to estimate the coefficients of LP3 distribution functions in the Morava and Belá River basins. These were recalculated to specific discharge qmax to make possible to compare runoff in different basins and to regionalize the results. We have proceeded as follows:
- we have estimated from the qmax series the parameters of LP3 distribution curves (mean X, standard deviation S and skewness coefficient G) separately for each station (Fig. 6, up, Table 2).
- We have added values of historical floods into the qmax series (Fig. 6, down) and we have calculated the historical regional skewness Gr (Table 2).
Fig. 6. Examples of the theoretical log Pearson probability exceedance curve type III,
of the maximum annual runoff of chosen streams, 5 and 95 % confidence intervals
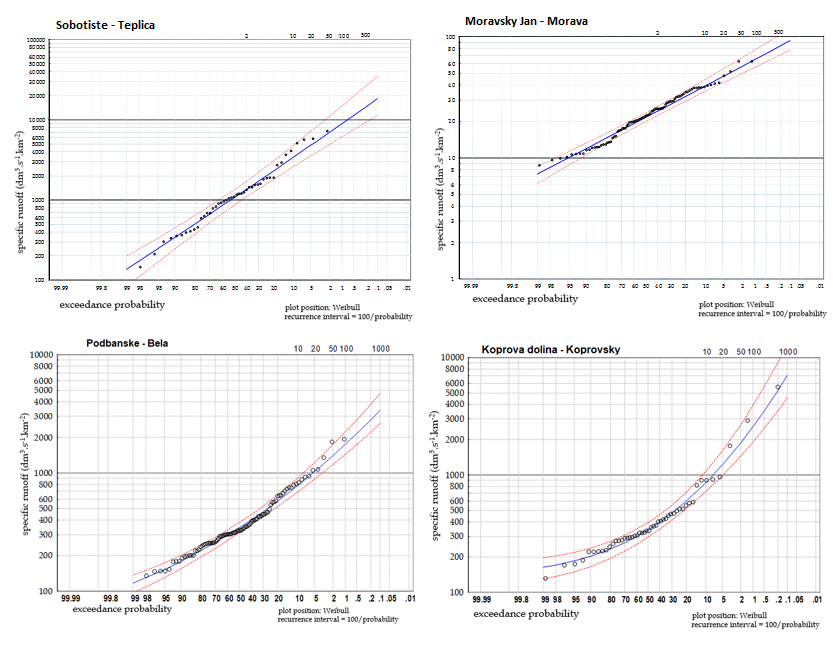
Table 2. Skewness coefficient G and regional skewness coefficient Gr
estimated for gauging stations
ID | Water gauge | Stream | G | Gr |
5010 | Lopašov | Chvojnica | 0.17 | 0.38 |
5025 | Sobotište | Teplica | 0.34 | |
5020 | Myjava | Myjava | 0.57 | |
5030 | Šaštín-Stráže | Myjava | 0.29 | |
5060 | Sološnica | Sološnický p. | 0.35 | |
5070 | Studienka | Rudava | -0.36 | |
5095 | Jakubov | Malina | 0.52 | |
5100 | Láb | Močiarka | 0.35 | |
5120 | Borinka | Stupávka | 1.19 | |
5040 | Moravský Svätý Ján | Morava | 0.19 | 0.27 |
5085 | Záhorská Ves | Morava | 0.36 | |
5400 | Podbanské | Belá | 0.82 | 0.73 |
5390 | Kôprová dolina | Kôprovský p. | 1.23 | |
5380 | Tichá dolina | Tichý p. | 1.14 | |
5460 | Račkova dolina | Račkov p. | 0.8 | |
5465 | Dovalovo | Dovalovec | 0.338 | |
5480 | Liptovský Hrádok | Belá | 0.9 |
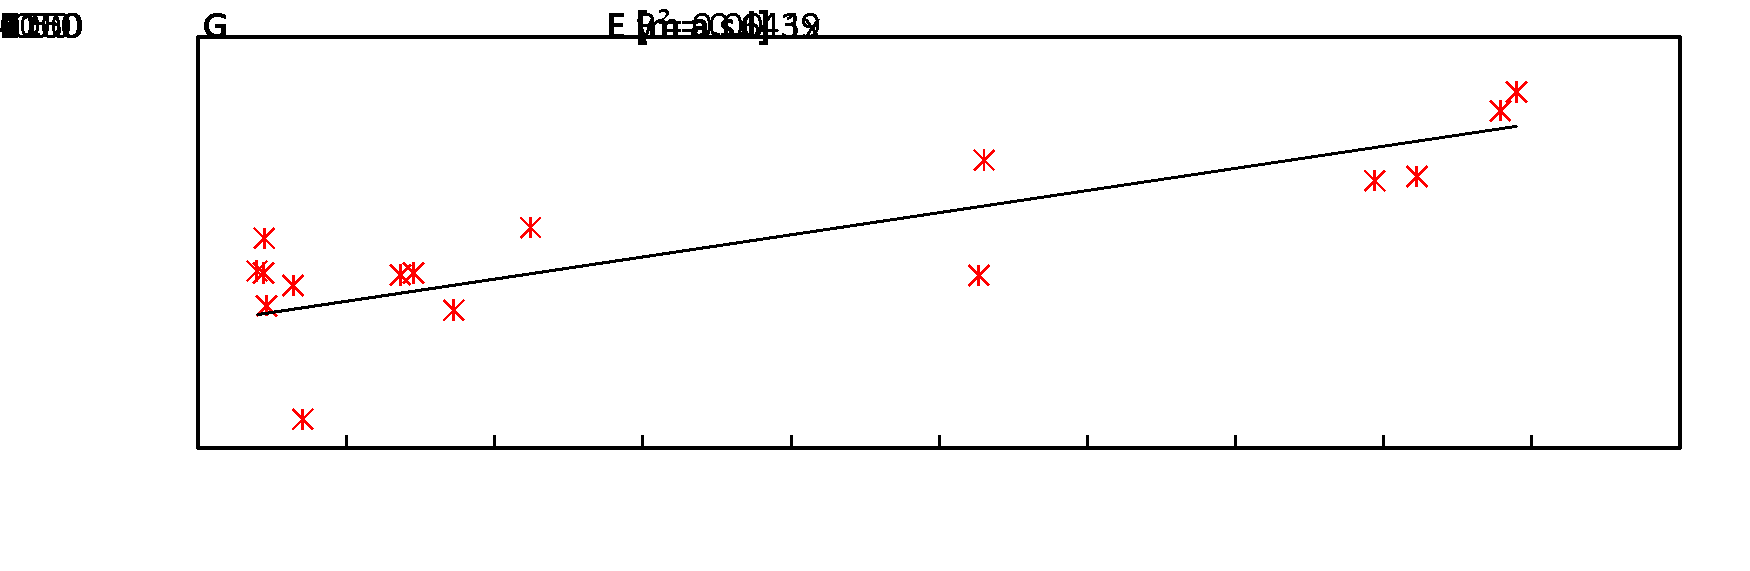
Fig. 7. The relation of the skewness coefficient G to elevation E of the station
- Then we have recalculated the parameters of the distribution curves for each station separately including historical floods into account. Applying the regional coefficients, we have estimated the design specific discharge of the qmax series listed in Table 3. The values are lying within the 5 and 95% confidence intervals.
- Finally, we have tested the relation between the skewness coefficient G and a set of the different physical-geographical characteristics of the basins. The example of the relation between the skewness coefficient G and the elevation of the stations E is presented in Fig. 7. The significance of the relation is not very high, but is simple and applicable.
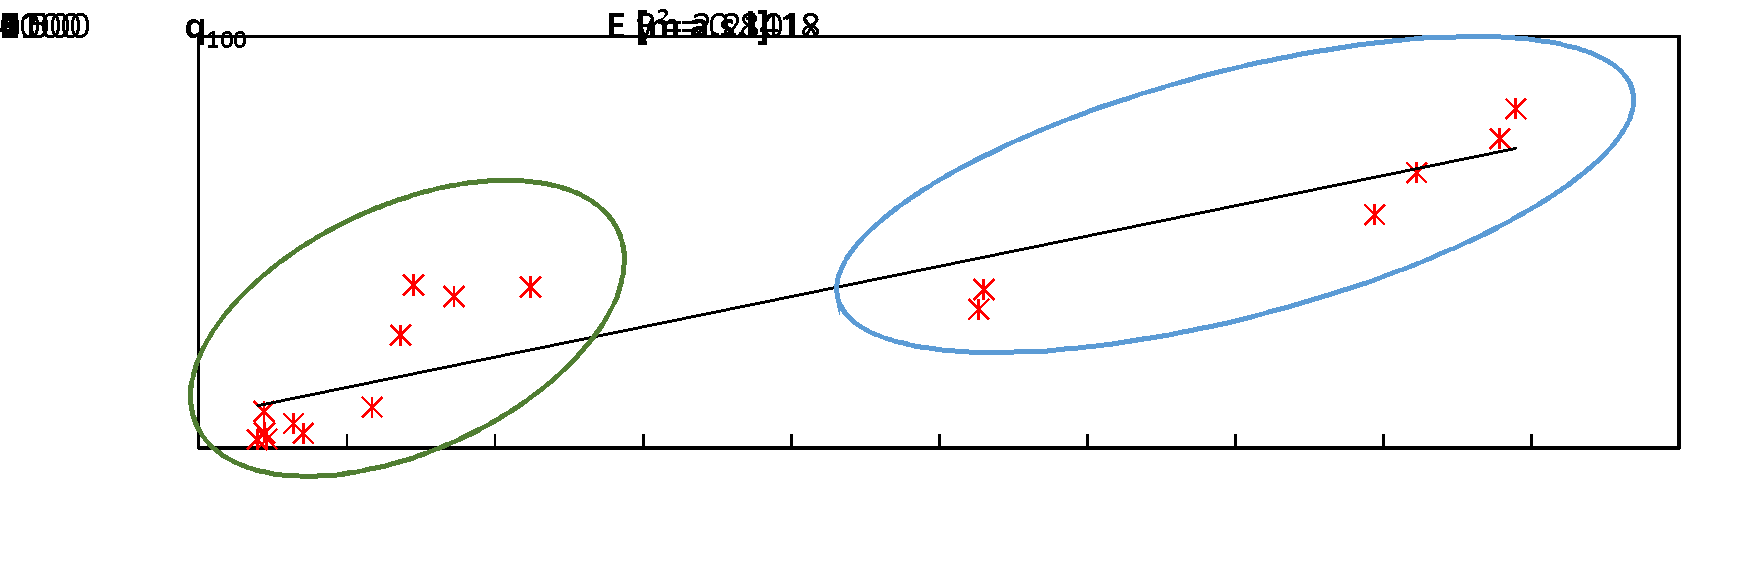
The highest values of specific discharge with the mean return period 1000 years occur in stations of higher elevation and smaller basin area. On the contrary, the smallest values occur in stations of lower elevation and bigger basin area (Fig. 8). Therefore, we have decided to establish the relation of q1000 to the elevation E. In Figs. 8a-b are depicted the empirical relations between q100 and q1000 and the elevation in both regions.
In Fig. 9 are the relations displayed for both regions separately for q1000. Using these regional relations, it is possible to estimate the 1000-year specific discharge from the elevation data in the ungauged profiles (Fig. 10). Water gauges are in the Morava basin at an altitude between 140 and 325 m a. s. l. and in the Bela basin between 627 and 990 m a. s. l. Therefore, for catchment area outside this altitude is not specific value of specific discharge estimated.
a)
b)
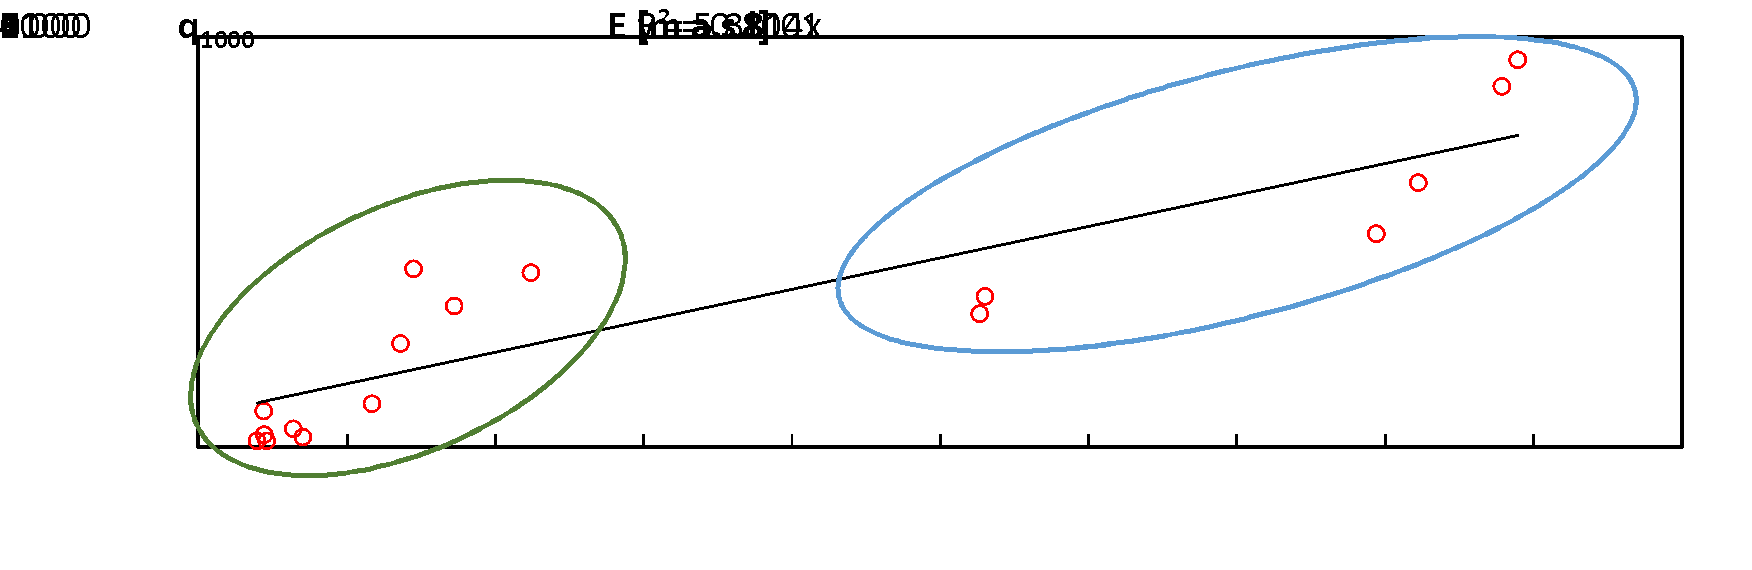
Fig. 8: a) The 100-year, and b) 1000-year specific discharge [dm3s-1km-2] in the Slovak part of the Morava River basin (green) and in the Belá River basin (blue) in relation to elevation E
Table 3. Estimated T-year design specific discharge [dm3s-1km-2], 5 and 95 % confidence intervals
water gauge stream | Probability T-year | 0,05 20 | 0,02 50 | 0,01 100 | 0,005 200 | 0,002 500 | 0,001 1000 |
Lopašov Chvojnica | q | 555 | 837 | 1102 | 1419 | 1931 | 2400 |
q(5) | 835 | 1349 | 1864 | 2513 | 3619 | 4683 | |
q(95) | 405 | 584 | 744 | 929 | 1217 | 1471 | |
Sobotište Teplica | q | 426 | 631 | 823 | 1053 | 1423 | 1762 |
q(5) | 638 | 1015 | 1393 | 1869 | 2681 | 3464 | |
q(95) | 313 | 443 | 560 | 694 | 901 | 1084 | |
Myjava Myjava | q | 551 | 860 | 1173 | 1573 | 2273 | 2968 |
q(5) | 817 | 1383 | 2003 | 2847 | 4430 | 6106 | |
q(95) | 409 | 606 | 794 | 1025 | 1409 | 1773 | |
Šaštín-Stráže Myjava | q | 108 | 144 | 176 | 211 | 163 | 309 |
q(5) | 132 | 182 | 227 | 279 | 359 | 430 | |
q(95) | 92 | 120 | 143 | 168 | 206 | 238 | |
Sološnica Sološnický p. | q | 535 | 860 | 1188 | 1606 | 2329 | 3038 |
q(5) | 836 | 1458 | 2137 | 3056 | 4760 | 6534 | |
q(95) | 381 | 579 | 770 | 1001 | 1384 | 1743 | |
Studienka Rudava | q | 70 | 90 | 107 | 124 | 149 | 169 |
q(5) | 93 | 126 | 153 | 183 | 226 | 263 | |
q(95) | 56 | 71 | 82 | 94 | 110 | 122 | |
Jakubov Malina | q | 65 | 89 | 110 | 135 | 172 | 206 |
q(5) | 85 | 122 | 156 | 198 | 264 | 325 | |
q(95) | 53 | 70 | 85 | 101 | 125 | 146 | |
Láb Močiarka | q | 132 | 199 | 265 | 345 | 481 | 610 |
q(5) | 183 | 294 | 409 | 558 | 822 | 1087 | |
q(95) | 103 | 148 | 190 | 240 | 322 | 397 | |
Borinka Stupávka | q | 146 | 220 | 295 | 391 | 560 | 729 |
q(5) | 201 | 328 | 465 | 652 | 1005 | 1381 | |
q(95) | 115 | 164 | 212 | 271 | 369 | 463 | |
Moravský Svätý Ján Morava | q | 45 | 56 | 65 | 75 | 89 | 101 |
q(5) | 51 | 65 | 77 | 89 | 108 | 123 | |
q(95) | 41 | 50 | 57 | 65 | 76 | 85 | |
Záhorská Ves Morava | q | 40 | 52 | 61 | 71 | 87 | 100 |
q(5) | 51 | 68 | 82 | 99 | 126 | 149 | |
q(95) | 34 | 42 | 49 | 56 | 66 | 75 | |
Podbanské Belá | q | 1074 | 1547 | 2008 | 2582 | 3559 | 4506 |
q(5) | 1287 | 1935 | 2594 | 3442 | 4943 | 6453 | |
q(95) | 925 | 1290 | 1635 | 2051 | 2739 | 3386 | |
Kôprová dolina Kôprovský p. | q | 1189 | 1816 | 2472 | 3342 | 4938 | 6601 |
q(5) | 1569 | 2583 | 3727 | 5338 | 8509 | 12042 | |
q(95) | 964 | 1399 | 1831 | 2379 | 3334 | 4283 | |
Tichá dolina Tichý p. | q | 1064 | 1643 | 2254 | 3069 | 4574 | 6151 |
q(5) | 1425 | 2381 | 3469 | 5014 | 8082 | 11529 | |
q(95) | 853 | 1250 | 1646 | 2152 | 3037 | 3919 | |
Račkova dolina Račkov p. | q | 945 | 1333 | 1703 | 2155 | 2911 | 3630 |
q(5) | 1193 | 1777 | 2366 | 3119 | 4440 | 5758 | |
q(95) | 789 | 1071 | 1329 | 1635 | 2128 | 2580 | |
Dovalovo Dovalovec | q | 530 | 775 | 1013 | 1306 | 1798 | 2267 |
q(5) | 758 | 1199 | 1657 | 2258 | 3336 | 4432 | |
q(95) | 407 | 567 | 715 | 889 | 1168 | 1423 | |
Liptovský Hrádok Belá | q | 628 | 896 | 1157 | 1481 | 2031 | 2564 |
q(5) | 791 | 1194 | 1609 | 2148 | 3112 | 4093 | |
q(95) | 525 | 720 | 903 | 1121 | 1479 | 1813 |
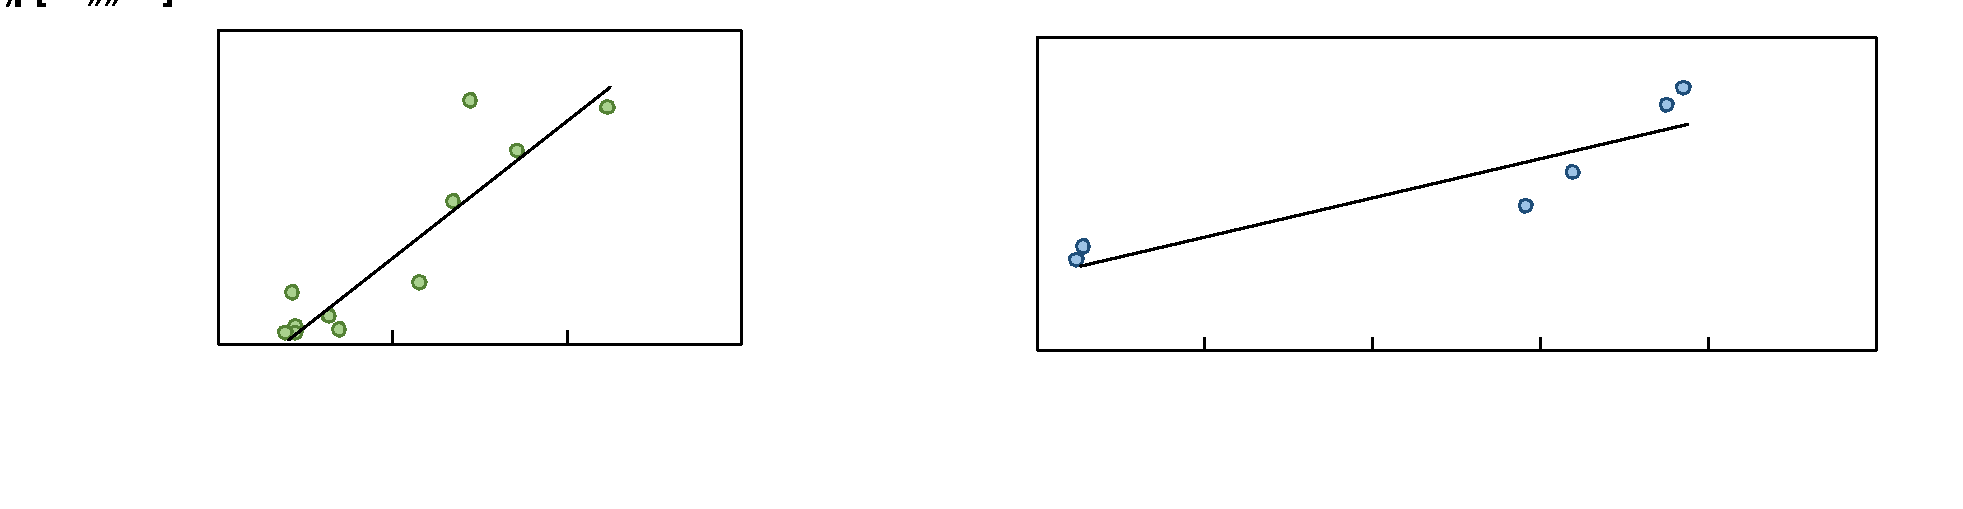
Fig. 9. The relation of the 1000-year specific discharge [dm3s-1km-2] on elevation E
in the Slovak part of the Morava River basin (left) and in the Belá River basin (right)
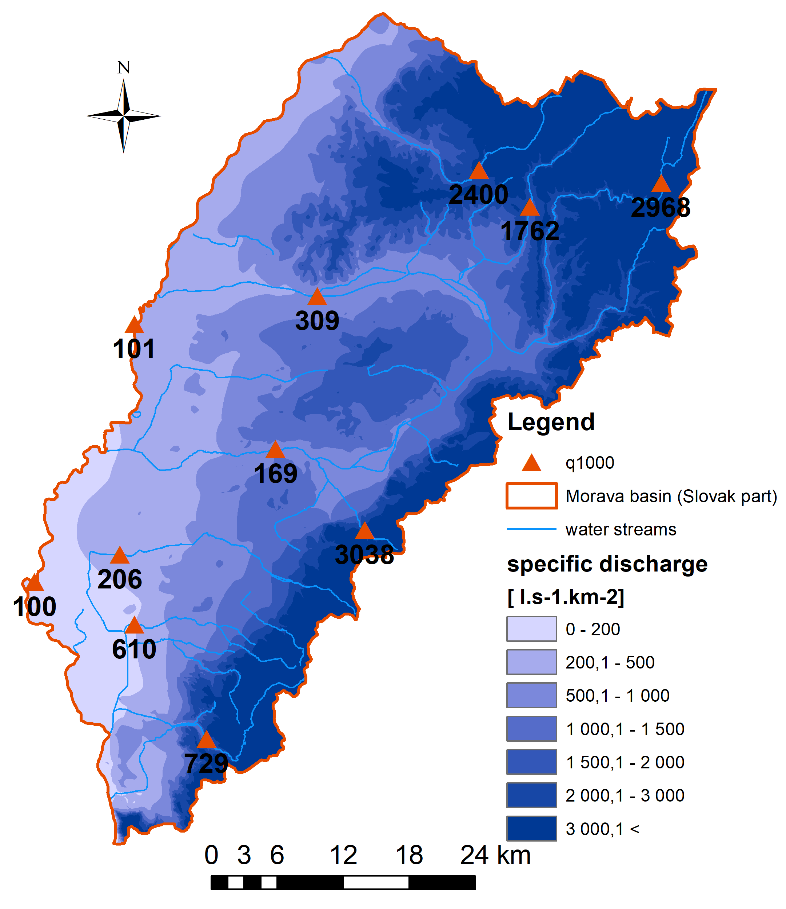
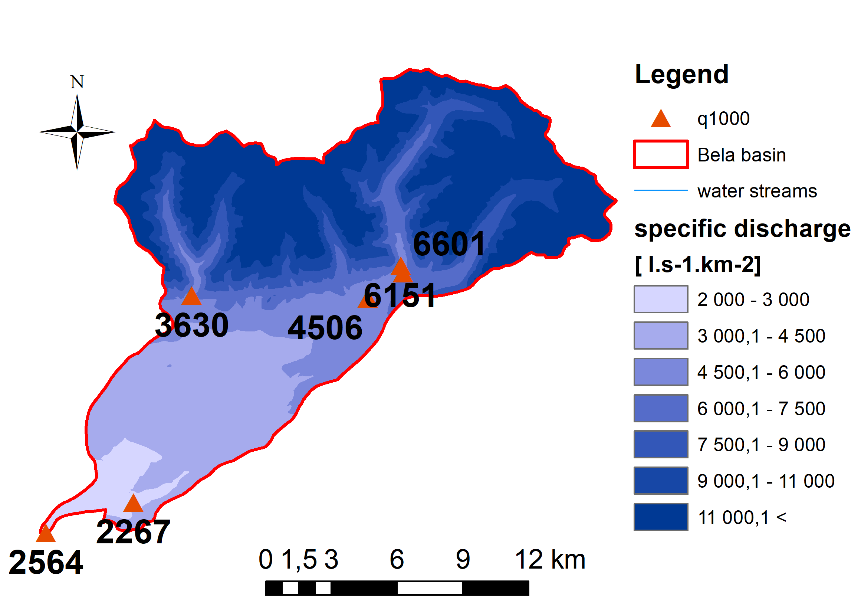
Fig. 10. Map of estimated 1000-year design specific discharge q1000 [dm3s-1km-2]
in the Slovak part of the Morava basin (upper) and in the Belá basin (lower)
CONCLUSIONS
In our study we present the results of estimation of the T-year specific discharge of the selected streams in the lowland basin of the Morava River and in the mountainous basin of the Belá River. We are testing application of the single probability distribution type (Log-Pearson Type III Distribution) to estimate the peak flow design values. Application of single distribution offers several advantages, e.g.:
1. During re-calculation of the distribution parameters after adding new data into series it is possible to track the changes of the distribution parameters (old results-new results);
2. It is also possible to track the changes of parameters after adding the data on historical floods;
3. LP3 distribution is widely used in many countries as a standard for calculation of the of T-year flows, therefore there exist several free available and easy to use EXCEL spreadsheets for estimation of the distribution parameters;
4. It is possible to regionalize the skewness coefficient of the LP3 distribution for different areas of the country or river basin. The usage of the regionalized skewness coefficient improves the estimation of the T-year flows in basins with short data series;
5. Application of only one distribution allows estimating easily the 5% and 95% confidence intervals of the design values, what is required nowadays and becomes a standard.
Regional skewness coefficient Gr of the Log-Pearson Type III Distribution was estimated to be 0.38 in the Morava basin taking into consideration the selected water gauging stations. The regional skewness coefficient has value of 0.27 for the main stream of the Morava River only. In the Belá River basin the regional skewness coefficient was estimated to be 0.73.
The values in Table 3 and on the Fig. 6 show that the uncertainty of estimation is high even in case of the 20-years design flows. For example, the 20-years design specific discharge can vary between 964 and 1569 dm3.s-1.km-2 with 90 percent probability in the subbasin of the Kôprovský creek in the closing profile of the Kôprovská valley.
Using the regional skewness coefficient has refined the estimation of T-year values, but there is still a high uncertainty in estimating design values for very long return periods. The accuracy improvement of the results can be expected after involving other variable physical-geographical properties of the river basins (e.g. forest area, geology, land use, soil types, river basin shape, etc.) into the estimation of the regional coefficients. These aspects will be considered in next steps of the analysis.
Better results were used when estimating the specific discharge using the empirical relation to the elevation. The derived empirical regional relations can be used to estimate the specific discharge of other streams in the region.
ACKNOWLEDGEMENTS
This study was supported by project VEGA 2/0009/15 and MVTS project “Flood regime of rivers in the Danube River basin”. In this study were used maximum annual discharge series from SHMI database and historical discharge from the database IH SAS – database of the MVTS project.
REFERENCES
Dysarz, T., Wicher – Dysarz., J., Sojka., M., Jaskuła., J. Analysis of extreme flow uncertainty impact on size of flood hazard zones for the Wronki gauge station in the Warta river. Acta Geophysica Acta Geophysica. 2019. P 16.
EP. Directive 2007/60/EC of the European Parliament and of the Council of 23 October 2007 on the assessmen and managment of flood risk. 2007.
Gaál, L., Szolgay, J., Kohnová, S., Hlavčová, K., Viglione, A. Inclusion of historical information in flood frequency analysis using a Bayesian MCMC technique: a case study for the power dam Orlík, Czech Republic. Contributions to Geophysics and Geodesy, 40, 2. 2010a. P. 121-147.
Gaál, L., Szolgay, J., S. Kohnová, S. Zohľadnenie historických povodní pri štatistickom určovaní návrhových maximálnych prietokov. Povodne 2010: Príčiny, priebeh a skúsenosti. Štrbské Pleso, VÚVH. 2010b. P. 7. [Gaál, L., Szolgay, J., S. Kohnová, S. Consideration of historical floods in statistical determination of design maximum flows (Zohľadnenie historických povodní pri štatistickom určovaní návrhových maximálnych prietokov. Floods 2010: Causes, course and experience. Štrbské Pleso, VÚVH. 2010b. P. 7.]
Hlubocký, B. Reprezentatívne povodie Belej – predbežné vyhodnotenie režimu povrchových vôd. Správa, HMÚ, Bratislava. 1974. P. 79. [Hlubocký, B. Representative basin of Bela - preliminary evaluation of surface water regime. A report, HMÚ, Bratislava. 1974. P. 79.]
HMÚ. Hydrologické pomery ČSSR, III. diel. Praha. 1970. P. 87-104. [HMÚ. Hydrological conditions of Czechoslovakia, III. part. Praha. 1970. P. 87-104.]
IACWD. Guidelines for determining flood flow frequency, Bulletin 17-B. Technical report, Interagency Committee on Water Data, Hydrology Subcommittee. 1982. P. 194.
Kohnová, S., Szolgay, J. K používaniu Dubovho vzorca pre výpočet maximálneho špecifického odtoku na malých povodiach na Slovensku. Vodohospodársky časopis 43, 1-2. 1995. P. 3-27. [Kohnová, S., Szolgay, J. To use of the Dub formula for calculating the maximum specific runoff on small river basins in Slovakia. Vodohospodársky časopis 43, 1-2. 1995. P. 3-27.]
Kohnová, S., Szolgay, J. K určovaniu maximálneho špecifického odtoku na malých povodiach. Vodohospodársky časopis 44, 2-3. 1996. P. 164-183. [Kohnová, S., Szolgay, J. To determine the maximum specific runoff on small river basins. Vodohospodársky časopis 44, 2-3. 1996. P. 164-183.]
Kohnová, S., Szolgay, J. Regional estimation of the index flood and the standard deviation of the summer floods in the Tatry mountains. J. Hydrol. Hydromech., 51, 4. 2003. P. 241–255.
Kohnová, S., Szolgay, J., Hlavčová, K. Hydroinformatika – Nové štatistické metódy odhadu návrhových prietokov a zrážok pre dimenzovanie hydrotechnických stavieb. STU Bratislava. 2006a. [Kohnová, S., Szolgay, J., Hlavčová, K. Hydroinformatics - New statistical methods for estimation of design flows and precipitation for sizing of hydraulic structures. STU Bratislava. 2006a.]
Kohnová, S., Szolgay, J., Solín, Ľ., Hlavčová, K. Regional methods for prediction in ungauged basins. Key Publishing, Ostrava. 2006b. P. 113
Merz, R., Blöschl, G. Flood frequency hydrology: 1. Temporal, spatial, and causal expansion of information. Water Resources Research, 44, 8, article number W08432. 2008a. P 17.
Merz, R., Blöschl, G. Flood frequency hydrology: 2. Combining data evidence. Water Resources Research, 44 (8), article number W08433. 2008b. P. 16.
MŽP: Kvantita povrchových a podzemných vôd. Hydrologické údaje povrchových vôd. Kvantifikácia povodňového režimu. Časť1: Stanovenie N-ročných prietokov a N-ročných prietokových vĺn na väčších tokoch. Odvetvová technická norma OTN ŽP 3112–1:03, MŽP SR, Bratislava. 2003. P. 31. [MŽP: Quantity of surface and groundwater. Hydrological data of surface waters. Quantification of the flood regime. Part 1: Determination of T-year flow rates and T-year flow waves at larger streams. Sector technical standard OTN ŽP 3112–1:03, MŽP SR, Bratislava. 2003. P. 31.]
MŽP. Plán manažmentu čiastkového povodia Moravy. Implementácia smernice 2000/60/ES Európskeho parlamentu a Rady z 23. októbra 2000, MŽP SR, Bratislava. 2015. P. 16-33. [MŽP. Management plan of sub-basin of Morava. Implementation of Directive 2000/60 / EC of the European Parliament and of the Council of 23 October 2000, MŽP SR, Bratislava. 2015. P. 16-33.]
Naghavi, B., Cruise, J., F., Arora, K. Comparative evaluation of three estimators of log Pearson type 3 distribution. Transportation Research Record, 1279. 1990. P 103–112.
Pacl, J. Váh – hydrologická štúdia. Dizertačná práca. PFUK, Bratislava. 1951. [Pacl, J. Váh - hydrological study. Dissertation. PFUK, Bratislava. 1951]
Pacl, J. Katastrofálna povodeň v oblasti Tatier v júni 1958. Sborník prác o Tatranskom národnom parku, zv. 3. 1959. P. 17-56. [Pacl, J. Catastrophic flood in Tatry region in June 1958. Proceedings of the Tatra National Park, zv. 3. 1959. P. 17-56.]
Pacl, J. Medzinárodná hydrologická dekáda skončila. Vodohospodársky časopis, 64, 4. 1977. P 382-392. [Pacl, J. The international hydrological decade is over. Vodohospodársky časopis, 64, 4. 1977. P 382-392.]
Pekár, J., Pekárová, P., Bačová Mitková, V., Holko, L., Kostka, Z. Historické povodne, regionalizácia a návrhové hodnoty N-rocných prietokov s krátkou dobou pozorovania v regióne Západných Tatier. Acta Hydrologica Slovaca, 13/1. 2012. P. 153-164. [Pekár, J., Pekárová, P., Bačová Mitková, V., Holko, L., Kostka, Z. Historical floods, regionalization and design values of T-year flows with short observation time in the West Tatras region. Acta Hydrologica Slovaca, 13/1. 2012. P. 153-164.]
Pekárová, P., Bačová Mitková, V., Pekár, J., Miklánek, P., Halmová, D., Liová, S. Historické povodne na území Slovenska a ich význam v hydrológii. Veda, vydavateľstvo Slovenskej akadémie vied. 2018. P. 135. [Pekárová, P., Bačová Mitková, V., Pekár, J., Miklánek, P., Halmová, D., Liová, S. Historical floods in Slovakia and their importance in hydrology. Veda, vydavateľstvo Slovenskej akadémie vied. 2018. P. 135.]
Pekárová, P., Halmová, D., Bačová Mitková, V., Miklánek, P., Pekár, J., Škoda, P. Historic flood marks and flood frequency analysis of the Danube River at Bratislava, Slovakia. J. Hydrol. Hydromech., 61, 4. 2013. P. 326-333.
Sochorec, R. Smernice pro spracování N-letých vod. HMÚ Ostrava. 1966. P. 16. [Sochorec, R. Directive for processing T-year flows. HMÚ Ostrava. 1966. P. 16.]
Pekárová, P., Halmová, D., Miklánek, P., Pekár, J., Škoda, P., Liová, S., Kučárová, K. Analýza homogenity meraní teploty vody v toku Belej v Podbanskom. Acta Hydrologica Slovaca 10,1. 2009b. P. 123-133. [Pekárová, P., Halmová, D., Miklánek, P., Pekár, J., Škoda, P., Liová, S., Kučárová, K. Homogeneity analysis of water temperature measurement in the Belá stream in Podbanské. Acta Hydrologica Slovaca 10,1. 2009b. P. 123-133.]
Pekárová, P., Mészáros, J., Pekár, J., Melová, K. Odhad N-ročných prietokov použitím regionálneho koeficientu šikmosti Log-Pearsonovho rozdelenia III. Typu. Acta Hydrologica Slovaca, 2019, roč. 20, č. 1. 2019. P. 22-31. [Pekárová, P., Mészáros, J., Pekár, J., Melová, K. Estimation of T-year flows using a regional skewness coefficient of Log-Pearson type III. Distribution. Acta Hydrologica Slovaca, 2019, roč. 20, č. 1. 2019. P. 22-31.]
Pekárová, P., Pacl. J., Liová, S., Miklánek, P., Škoda, P., Pekár, J. Analýza režimu maximálnych ročných prietokov vysokohorského toku Belá v Podbanskom. Acta Hydrologica Slovaca, 10,2. 2009a. P. 300-311. [Pekárová, P., Pacl. J., Liová, S., Miklánek, P., Škoda, P., Pekár, J. Analysis of the regime of maximum annual flows of the Belá mountain stream in Podbanské. Acta Hydrologica Slovaca, 10,2. 2009a. P. 300-311.]
Stanescu, V.A. Regional analysis of annual peak discharges in the Danube Catchment. The Danube and its catchment—A hydrological Monograph, Followup volume VII. Regional Co-operation of the Danube Countries in the Frame of the International Hydrological Programme of UNESCO, Bucharest. 2004.
Šipikalová, H. Spracovanie hydrologických charakteristík – N-ročné maximálne prietoky. SHMÚ, Záverečná správa čiastkovej úlohy 5303-00. 2006. P. 90. [Šipikalová, H. Assessment of hydrological characteristics - T-year maximum flows. SHMÚ, Final report of the partial task 5303-00. 2006. P. 90.]