ESTIMATION OF THE FLOOD MAXIMUM VOLUMES FOR VARIOUS DURATIONS OF THE RIVER RUNOFF AND THEIR MUTUAL DEPENDANCES: A CASE STUDY ON HRON RIVER IN SLOVAKIA
Veronika Bačová Mitková, Dana Halmová
Institute of Hydrology Slovak Academy of Sciences, Dúbravska cesta 9, 841 08 Bratislava, Phone: +421232293502, Slovak Republic
Corresponding author: Dana Halmová, IH SAS, Dúbravska cesta 9, 841 08 Bratislava, e-mail: halmova@uh.savba.sk
ABSTRACT
This work deals with the determination of the annual maximum discharge volumes on the Hron River for the runoff time duration t = 2, 5, 10, and 20 days. The series of 84 years (1931–2015) mean daily discharges of the Hron River at Banská Bystrica station was used as input data to calculate the maximum annual volumes of runoff of the Hron River. Subsequently, the theoretical curves of exceedance of the maximal discharge volumes were determined by the LogPearson distribution of the Type III. This type of probability distribution is used to estimate maximum (extreme) values across a range of natural processes. The results of the estimated T-year volumes by using PL III distribution were compared to other types of theoretical distribution functions used in hydrological extreme analyses in Slovakia (Gamma, Log-normal, etc.). The second part of our work was focused on the bivariate modelling of the relationship between T-year maximum volumes with different duration and peak discharges. In the case of modelling without evaluating this mutual dependence of the flood wave characteristics, they may be overestimated (in the case of the negative dependence) or underestimated (in the case of the positive dependence). The Archimedean class of copula functions was used as mathematical tool for the dependence modelling. The LP III distribution was used as marginal probability distribution function. Subsequently joint and conditional return periods of the T-year maximum annual flows and T-year maximum volumes with different time duration were calculated. The first one defines joint return periods as: the return periods using one random variable equaling or exceeding a certain magnitude and/or using another random variable equaling or exceeding another certain magnitude. The second one is conditional return periods for one random variable, given that another random variable equals or exceeds a specific magnitude.
Keywords: Hron River, maximum runoff volume, peak discharge, probability distribution, T-year volume, copula function.
INTRODUCTION
Solution of some water management tasks requires not only knowing maximum discharge but also the shape of the flood wave or at least its volume. The volume of the flood waves and its importance is evaluated rarely. In the study of the flood wave parameters the attention is usually given to the culmination or maximum water level. The significance of the flood wave volume as an important hydrological characteristic was evident, e.g. during the flood in 1965 on the Danube river, when the protective dams ruptured due to the occurrence of extremely long, high levels of flood water. One of the first hydrologist who to deal with the theoretical processing of flood volumes in Slovakia was Bratranek (1937). In the first case, he processed the volumes of all major floods above the selected limits of discharges using the return period curve. T-year volumes determined from the extrapolated return period curve. In the second case author T-year volumes determined from generalized results of wave processing. The disadvantage of this method was that the derived formula could not be used for volumes with less probability of discharge exceedance than is return period of 20 years. Zatkalik (1970) dealt with the calculation of the maximum volumes of the Danube River waves. The author takes into account the duration of the flood wave in days in the procedure of the maximum volumes calculatiion. The study, analysis and estimation of the flood wave volumes corresponding to the maximum design discharge with a return period of T on Danube River in Slovakia was reported in last years in e.g. Mitková et al., 2002; Halmová et al. 2008; Szolgay et al. 2012 or Pekarova et al. 2018.
From foreign authors the determination of maximum volumes was, for example, addressed by Beard (1956). The author used the theoretical curves of exceedance to calculate the annual maximum volumes of the different probability taking also into account the duration of the flood wave. The mathematical expressions for probability distribution of runoff volume and the maximum discharge from the selected basin derived Guo and Adams (1998). The modelling of flood flows and flood wave volumes using special statistical methods has also been addressed by Mediero et al. (2010). The hydrological model and formula for determining the hypothetical flood wave volume in non-gauged basins for the area of Upper Vistula River was presented by Gądek and Bodziony (2015).
In addition to the estimation of the N-year maximum flood wave volumes there is also a need to model the development of two risk hydrological factors that are dependent on each other. In the case of modelling without evaluating this mutual dependence of the flood wave characteristics, they may be overestimate (in the case of negative dependence) or underestimate (in case of positive dependence). The traditional approaches to analyzing dependencies between variables, such as flood discharge and volume, can be described by the classical class of two-dimensional distributions. Such a class can be considered two-dimensional copula functions. Many hydrologists analyzed mutual dependence between the components of the hydrological cycle to identify the flood-generating processes using the copula functions (Ashkar and Rousselle, 1982; Salvadori and De Michele, 2004; Sraj et al., 2014; Brunner et al., 2016; Stamatatou et al., 2018 and etc.). In Slovak conditions, Gaal et al. (2010); Bačová and Halmová (2014); Szolgay et al. (2016); or Kohnova et al. (2016), dealt with the modelling of multidimensional time series in the field of natural sciences, especially the relation of maximum discharges, volume and eventually the duration of flood waves. The correlation dependencies between the individual elements of the flood waves were also analyzed by Bezak et al. (2015) or Papaioannou et al., (2016) and etc.
This paper is focused on determination of maximum volumes of given duration of runoff (2, 5, 10 and 20 days) on the Hron River at Banská Bystrica during the period of 1931–2015. Subsequently, the theoretical curves of exceedance of the maximum discharge volumes Vtmax will be determined by the selected probability distributions and the T-year maximum annual volumes was estimated. At the end of the article an analysis and statistical evaluation of the mutual dependence and occurrence of maximum discharges and volumes with different time duration using the copula functions will be estimated. Results of the analysis will be discussed and presented in figures and tables.
METHODS AND DATA (STUDY AREA)
Determination of annual maximum volumes of a given duration
The series of mean daily discharges (1931–2015) of the Hron River at Banská Bystrica station was used as input data. Maximum volumes with time durations t (2, 5, 10 and 20 days) of the wave was determined. If the wave duration was less than 20 days the steady discharges were included into the analysis. Figure 1 presents example of the determination of maximum volumes with given durations. In case of the flood in 1974 and t=5 days the fifth 5-daily move averages were calculated around the culmination. Consequently, only one maximum value was included into the statistical data set for analysis (Fig. 1).
Estimation of the T-year maximum annual volumes for different durations of the runoff on the Hron River at Banská Bystrica (1931–2015)
In our analysis we use one type of the theoretical probability distribution the Log-Pearson distribution type III (LP III). The advantage of this particular technique is that extrapolation can be made of the values for events with return periods well beyond the observed flood events. This theoretical distribution belongs to the family of Pearson distributions, so called three parametric Gamma distributions, with logarithmic transformation of the data. Its parameters are median μ, variation σ2 and asymmetry . In many countries is LP III distribution used as a first chose for flood. Parameters can be determined by several methods e.g.: LGMO – method of logarithmic moments, RLMO – method of real moments or MXM – method of mixed moments.

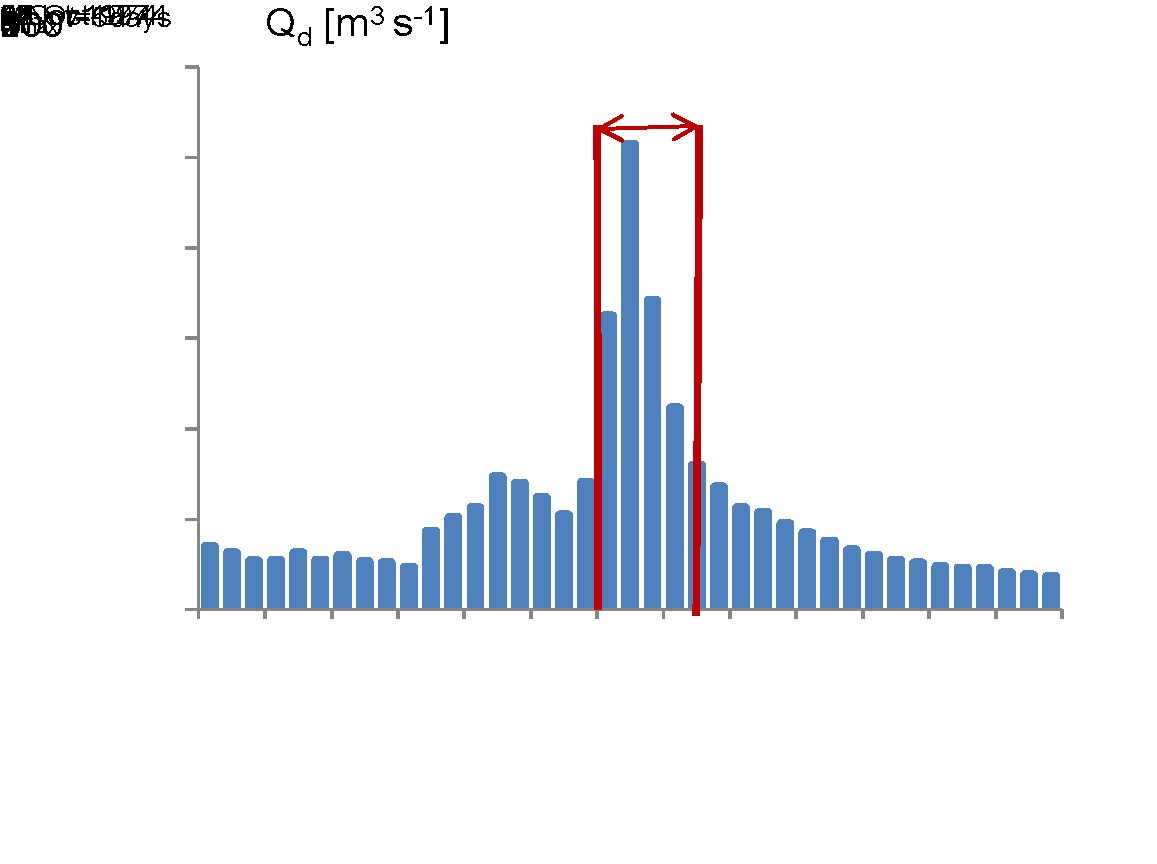
Fig. 1. A scheme for determining of the maximum flood wave volume on Hron River:
Banská Bystrica for flood in 1974 for t=5 days
The cumulative distribution function and probability distribution function according Hosking and Wallis (1997) are defined as:
If ![]() ≠ 0 let α=4/
≠ 0 let α=4/ ![]() 2 and ξ=μ-2σ/
2 and ξ=μ-2σ/ ![]()
If ![]() ˃0 then:
˃0 then:
![]() , (1)
, (1)
![]() (2)
(2)
If ![]() <0 then
<0 then
![]() (3)
(3)
![]() (4)
(4)
where: μ - location parameter; σ - scale parameter; γ - shape parameter; Γ – Gamma function.
In the world literature, there are a number of scientific papers dealing with the selection and testing of the suitability of theoretical probability distributions in estimating the maximum values of hydrological characteristics. Therefore, we compared the LP III distribution with the theoretical probability distributions that were (and still are) most widely used hydrological practice in Slovakia: Gamma distribution and Log-normal distribution. To verify the accuracy of theoretical distributions, we used a non-parametric Kolmogorov-Smirnov goodness of fit test for the significance level α = 0.05.
Analysis of the dependence between maximum annual volumes with different duration and maximum annual discharges on the Hron River at Banská Bystrica by copula functions
Joint distribution function –copula functions
Copula functions were used as mathematical tool for determining a joint cumulative distribution of two dependent variables. We used the Archimedean class of copula functions. Among existing types of copulas, the Archimedean one is the very popular class used in hydrological application. This class of copulas is popular in empirical applications for flexibility, easy construction and includes a whole suite of closed-form copulas that covers a wide range of dependency structures, including comprehensive and non-comprehensive copulas, radial symmetry and asymmetry, and asymptotic tail dependence and independence. The Clayton, Gumbel-Hougaard and Frank copulas were selected for this study (Table 1). The copula parameter θ was estimated using a mathematical relationship between the Kendall`s coefficient of rank correlation and the generating function φ(t) (Nelsen, 2006).
Table 1. Probability functions, parameter space, generating function and relationship of nonparametric dependence measure with association parameter for the most frequently used Archimedean copulas
Copula function | C (u, v, θ) | Parameter θ | Kendall's τ | Generator φ(t) |
Clayton | [-1,) /{0} | |||
Gumbel-Hougaard | [1,) | |||
Frank | (-,)/{0} |


Joint and conditional return period.
In hydrological frequency analysis the return period of the hydrological variable that occurs once in a year, we can define as:
 (5)
(5)
where, T is return period in years and F(x) is univariate cumulative distribution function.
In multivariate statistical analysis, we can determine the return period of the phenomenon in two ways. The first is a joint return period and second, is a conditional return period.
Joint return period for two variables defined more authors (Shiau, 2003; Salvadori and De Michele, 2004) and it can be written in the form:
 (6)
(6)
or
 (7)
(7)
Equation (6) represents joint return period of X≥ x and Y≥ y. Equation (7) represents joint return period of X≥ x or Y≥ y. These relationships indicate, that different combinations of the numbers x and y, can take same return period (equation 8). H(x, y) is the joint cumulative distribution function (can be expressed as copula function).
 (8)
(8)
Conditional return period for X given Y≥y may be expressed as:
 (9)
(9)
where x and y are random variables and H(x, y) is the joint cumulative distribution function.
An equivalent formula for conditional return period of Y given X≥x can be obtained.
RESULTS AND DISCUSSION
Hron River basin and input data
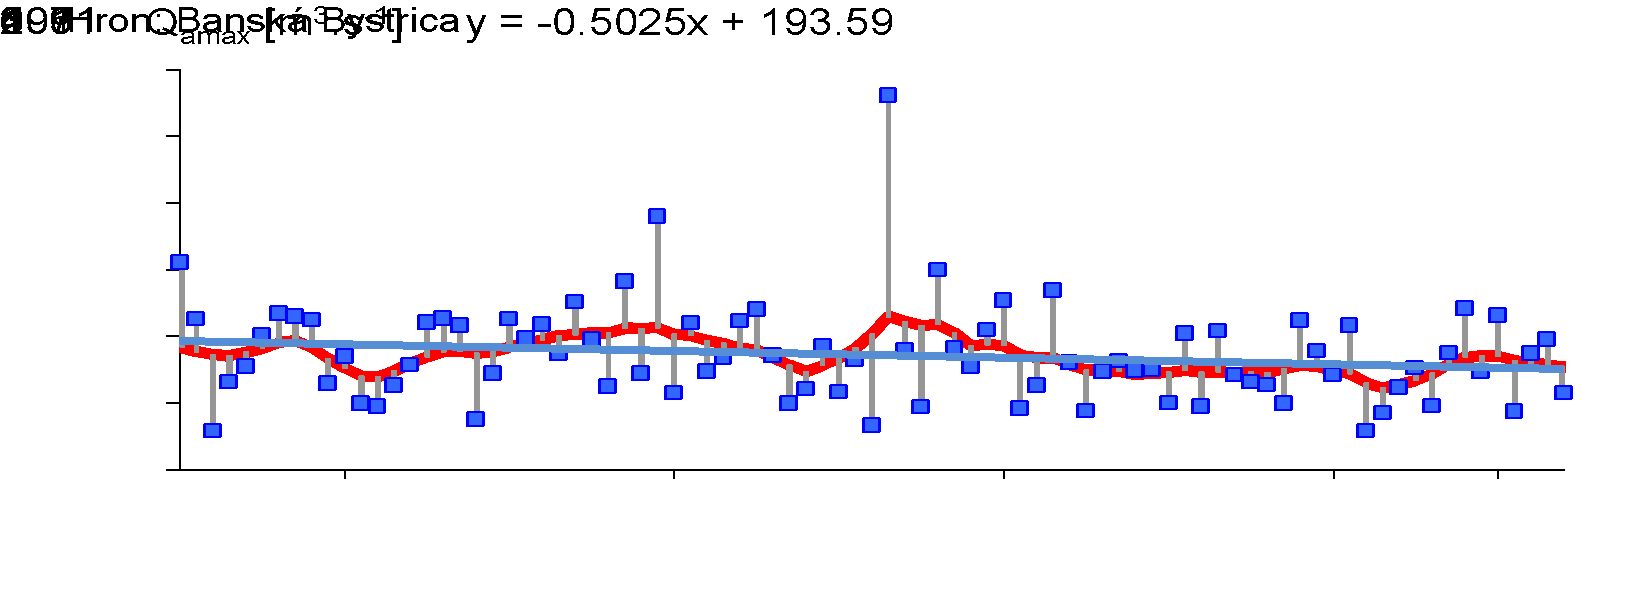
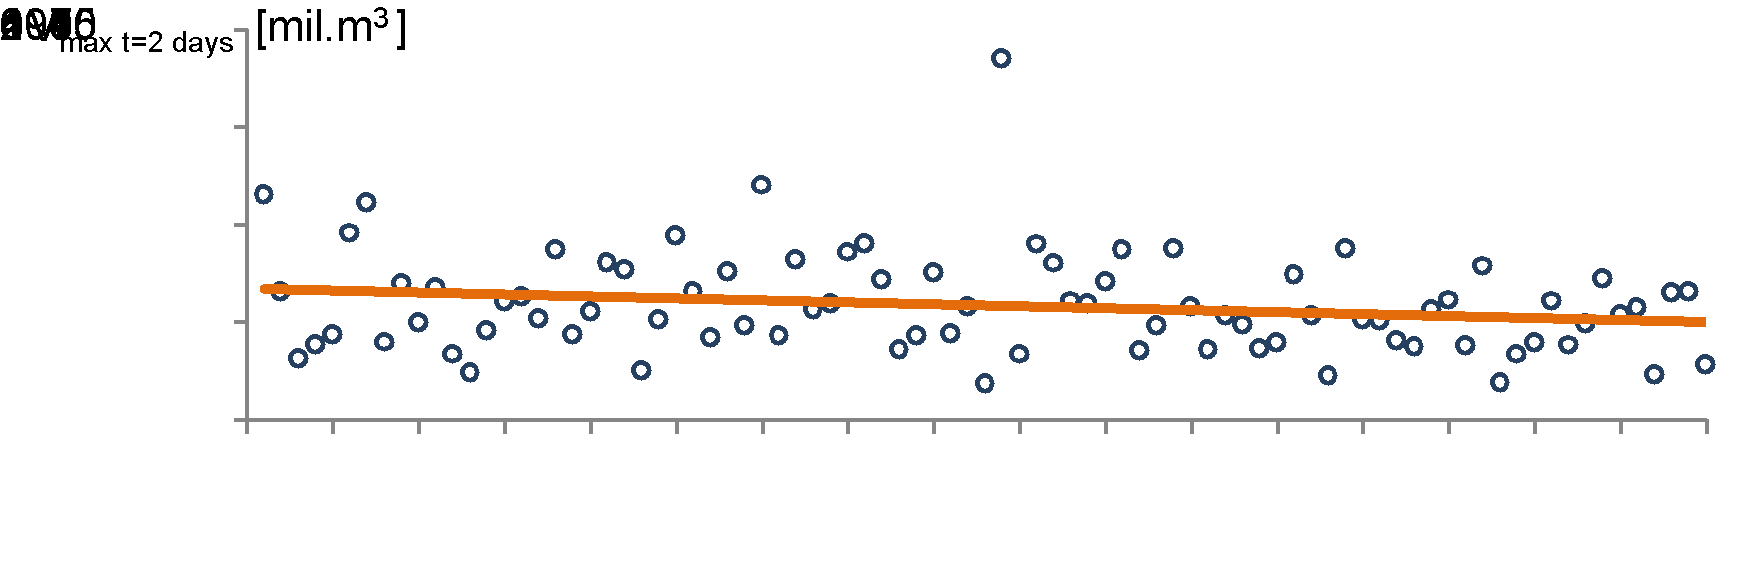
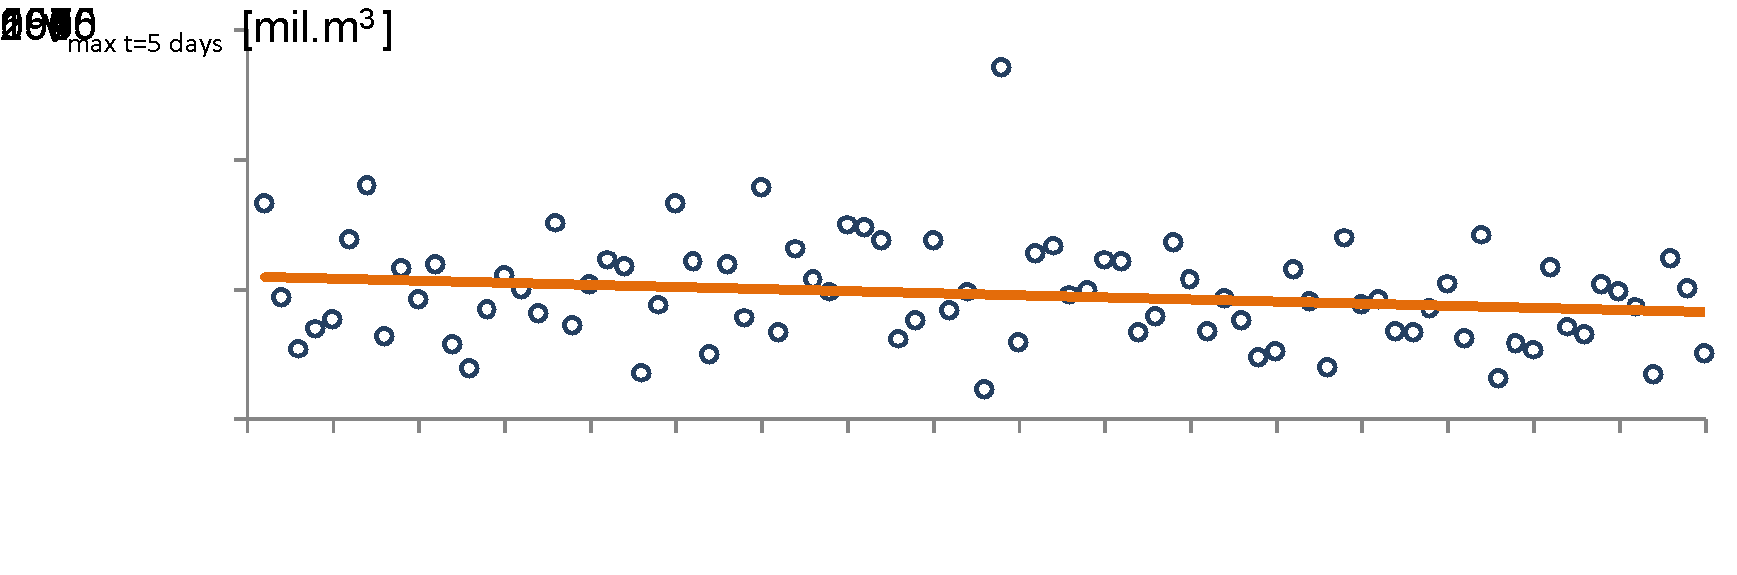
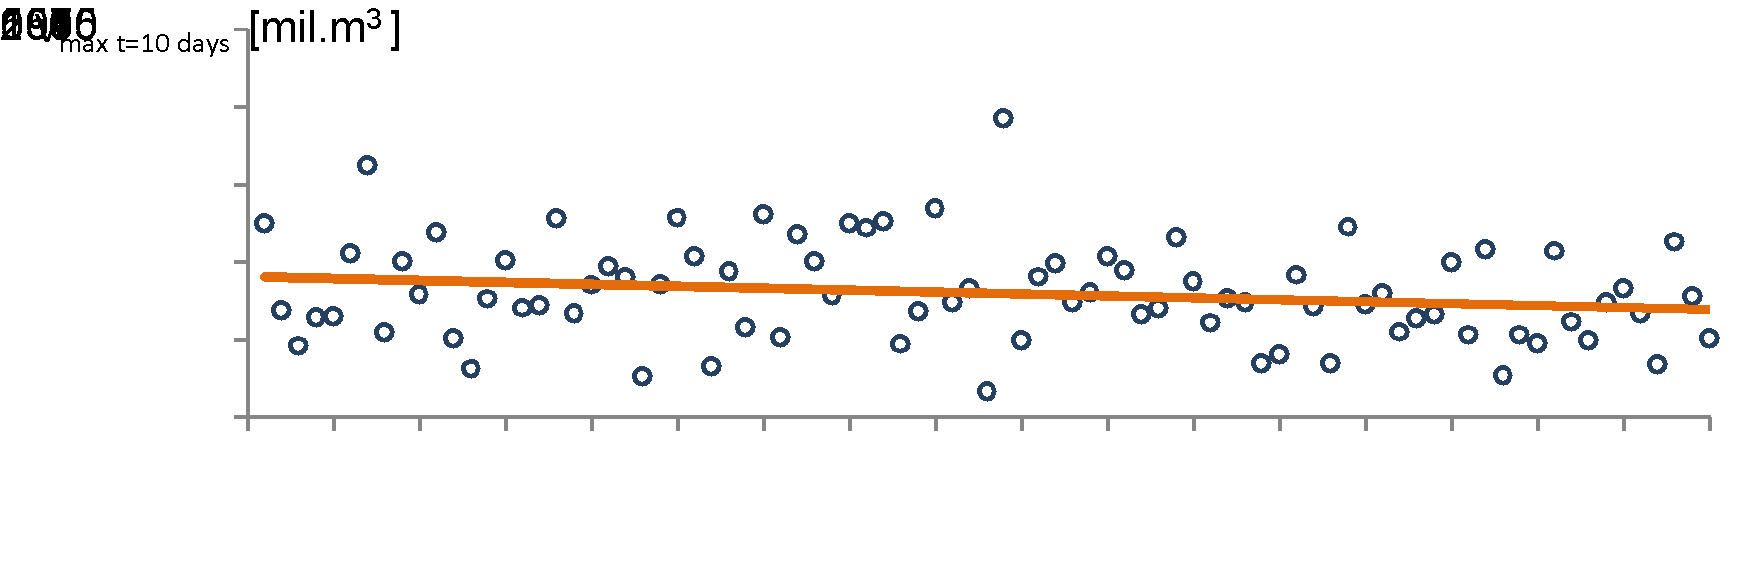
The Hron River is the second longest Slovak river. It measures 298 km and flows only through the territory of Slovakia and flows into the Danube above Štúrovo. Hron springs in Horehronské podolí, in contact with Low Tatras and Spiš-Gemer karst. Hron after Banská Bystrica drains the drainage area of 1 766.48 km². The long-term mean daily discharge during 1931–2015 amounted to 25.9 m3s-1 in Banská Bystrica. The maximum discharge during the analyzed period at the station Banská Bystrica was 560 m3s-1 (October, 1974). The probabilities of exceedance curve of the maximum annual discharges according to LP III probability distribution is shown in Figure 2. The course of the maximum annual discharges and their long-term trend is shown in Figure 3a. The annual maximum discharges show a slightly decreasing trend. Deviations from the long-term mean annual discharges in the analyzed period show the occurrence of three dry periods 1941–1945, 1985–1991 and 2003–2007 (Figure 3 b). The years from 1951 to 1956 we can refer as a longer wet period and two highest discharges during the whole period were recorded in 1960 and 1974 (Figure 3 b). Scenarios of changes in selected components of the hydrosphere and biosphere in the Hron River basin are described in Pekarova and Szolgay (2005). In terms of 2 to 10 days maximum volumes, the flood in 1974 was the largest flood during the period of 1932–2015. The maximum number of maximum annual discharges was occurred in April and mean time duration of the waves was 20 days. The time course of the selected maximum runoff volumes on the Hron River at Banská Bystrica for the runoff times duration t= 2, 5, 10 and 20 days is shown in Figure 4 a-d and show a slightly decreasing linear trend.
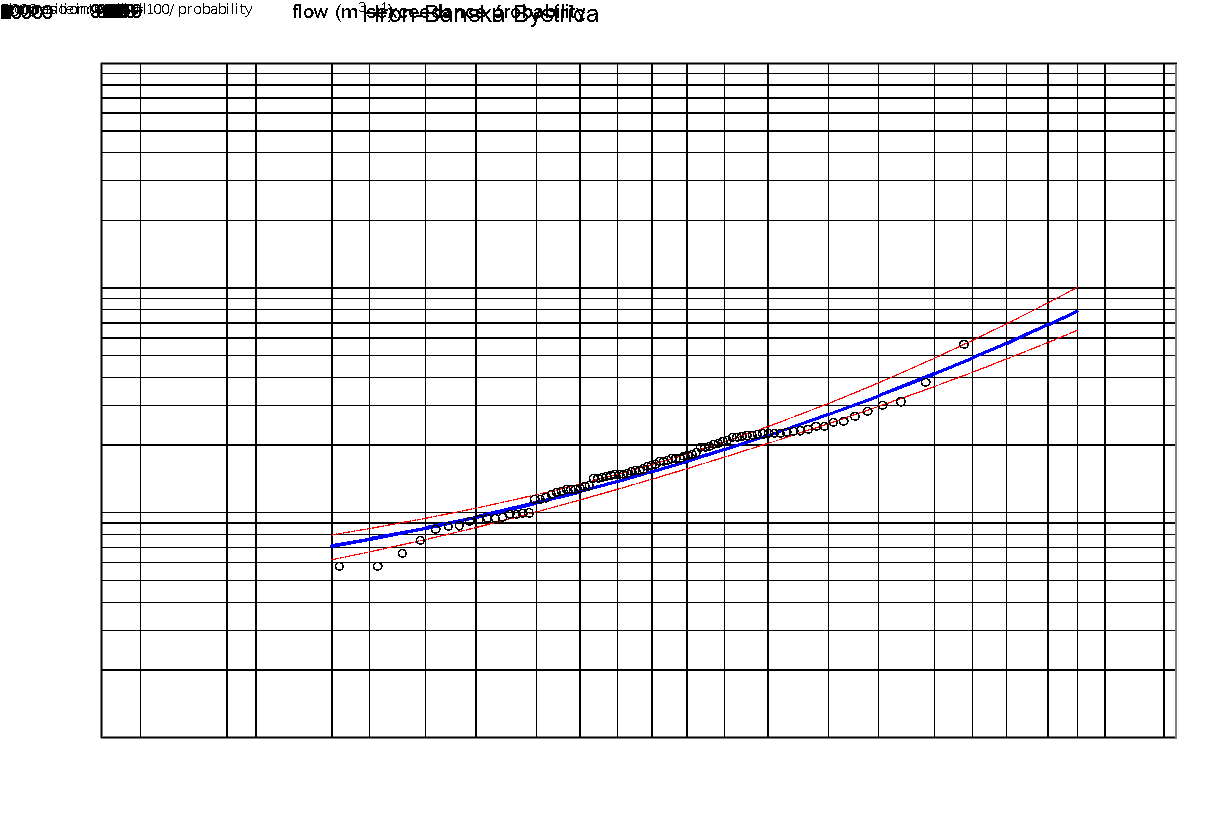
Fig. 2. The exceedance probability curve of the annual peak discharges of the Hron River:
Banská Bystrica during the period of 1931–2015 (Log-Pearson III distribution)
a)
b)
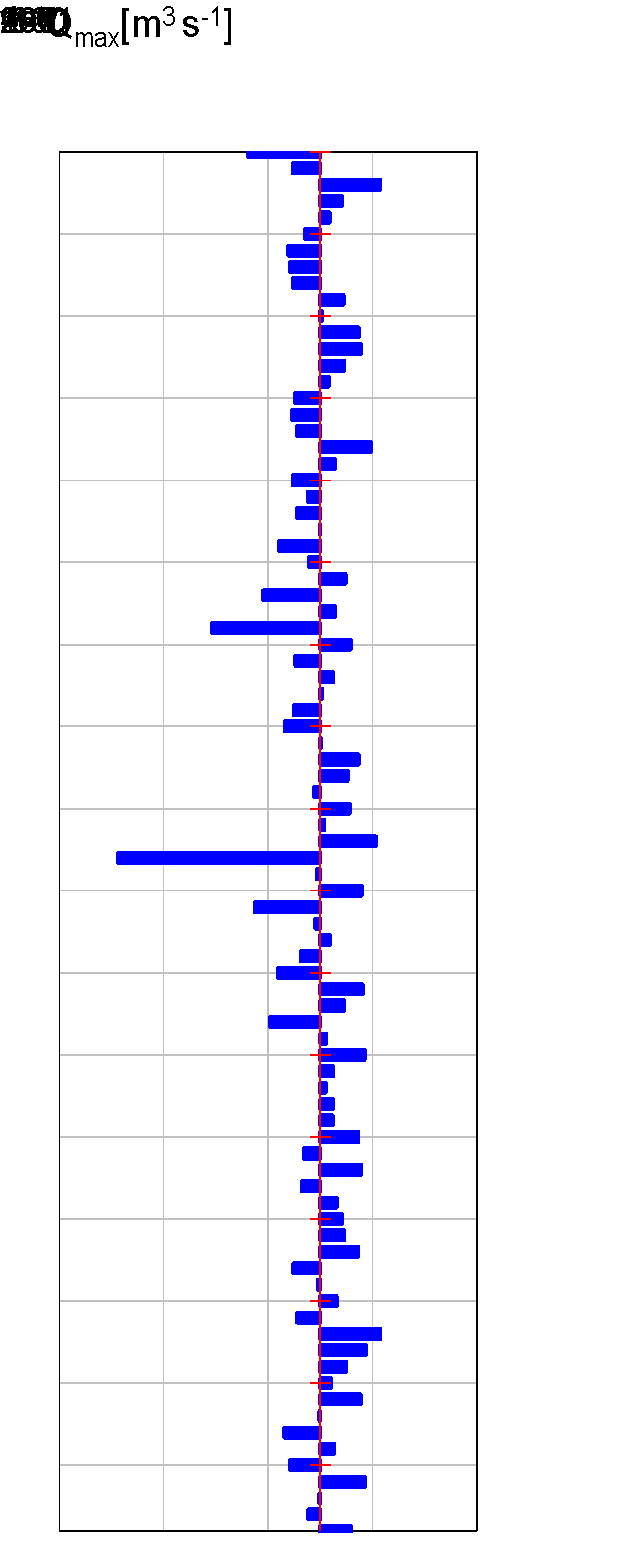
Fig. 3: a) Maximum annual discharges of Hron River: Banská Bystrica, their linear trend and
5-year moving trend and b) deviation from long-term mean annual discharge during the period of 1931–2015
a)
b)
c)
d)
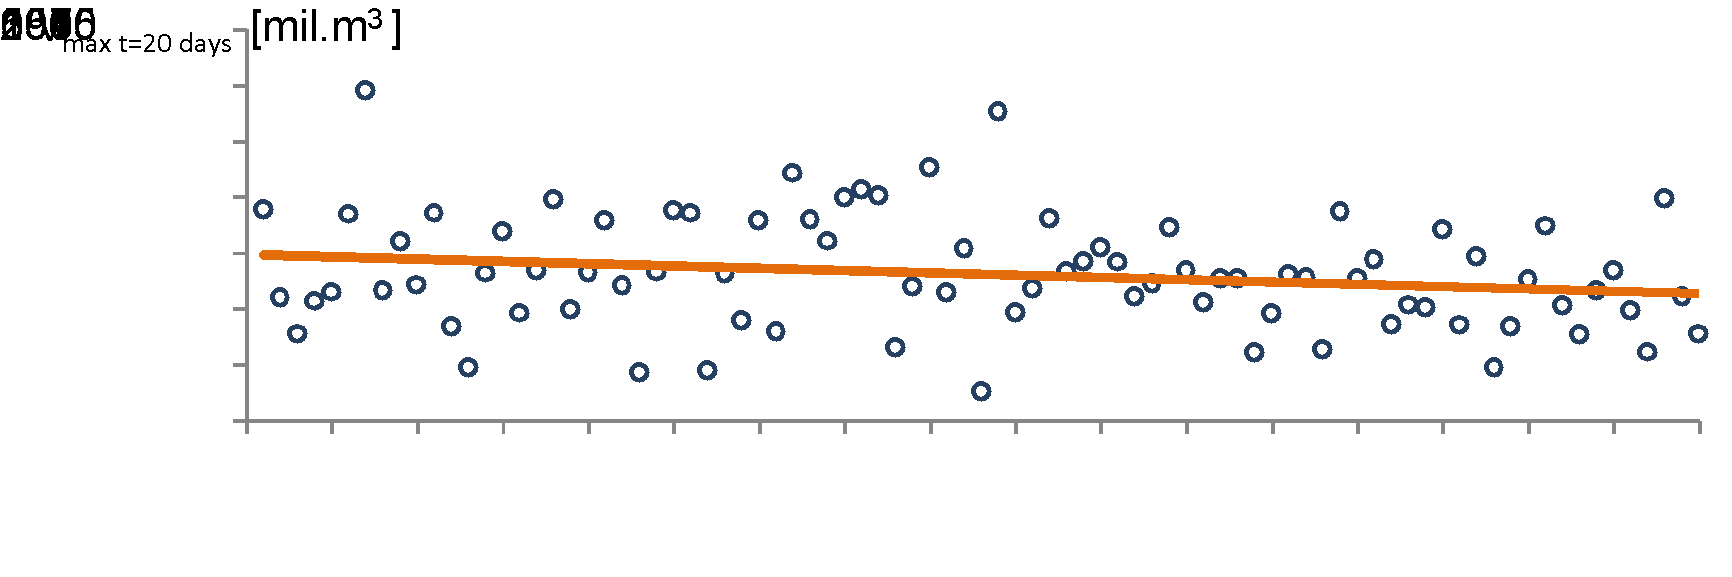
Fig.4: a)-d) Flood wave annual maximum volumes for various flood duration
of the Hron River: Banská Bystrica during the period of 1931–2015
Return period of the maximum volumes for different runoff duration on the Hron River at Banská Bystrica
The series of Vtmax has been arranged descending separately for runoff durations, and for individual members of the series have been attributed probability of exceedance.
The calculation of the theoretical maximum volume overrun curve was done using LP III theoretical probability distribution. Subsequently, the calculated T-year maximum volumes Vtmax were estimated for given discharge values. The relationship between the probability of exceedance a certain value in any year and its average return period is (Szolgay, 1994):
p = 1 – e-1/T (10)
If N ≥ 10 than
p = 1/T. (11)
Figure 5 shows the exceeding probabilities of the maximum annual volumes for different values of the flood wave duration t = 2, 5, 10 and 20 days on the Hron River at Banská Bystrica. Estimated values of T-year maximum annual runoff volumes for given duration according selected LP III, Gamma and Log-normal distributions are listed in table 1. Kolmogorov-Smirnov test shoved that we cannot reject hypothesis that selected theoretical probability distributions fit well the observed data at 5% significance. Results shoved relatively small differences between estimated values of Tyear maximum volumes when comparing the individual types of theoretical probability distributions used in hydrological analyses of extremes in Slovakia. The Gamma theoretical probability distribution reached the lowest values of estimated T-year maximum volumes Vtmax, especially for volumes with high return periods (Table 2).
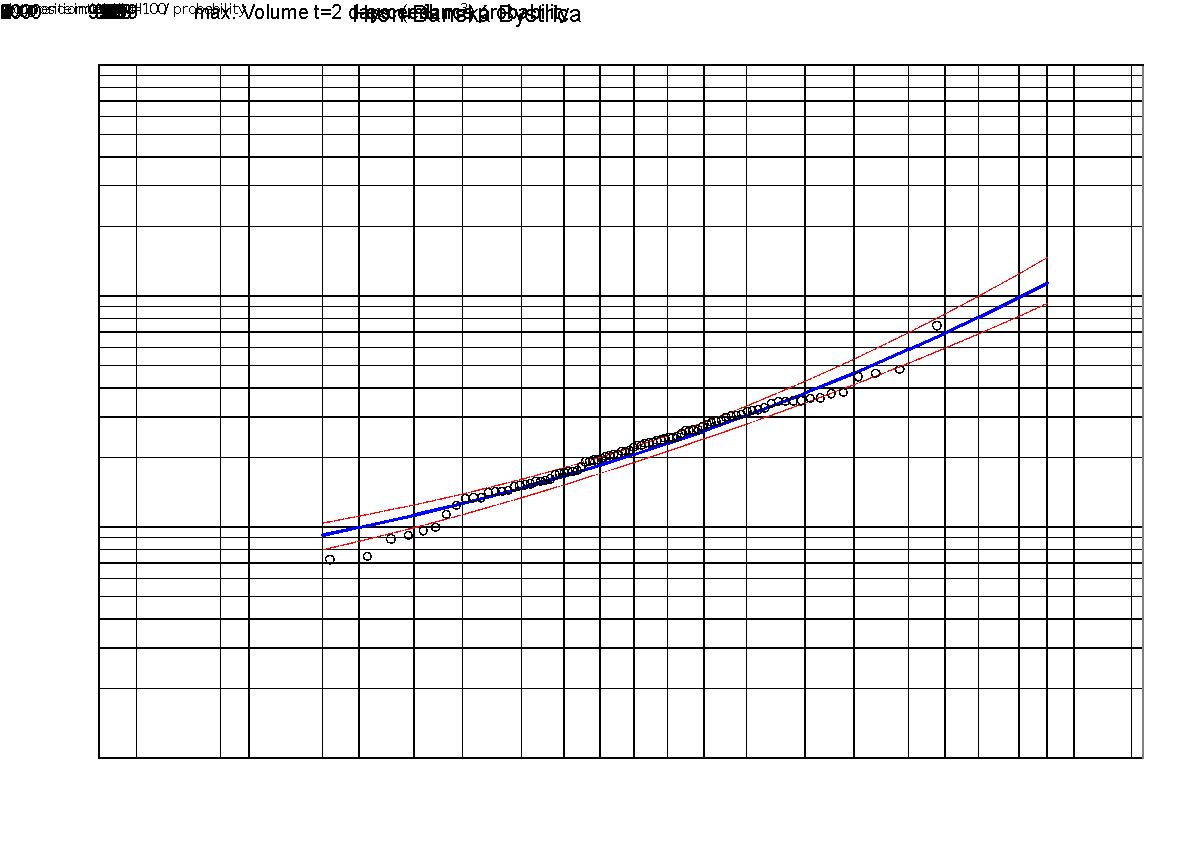
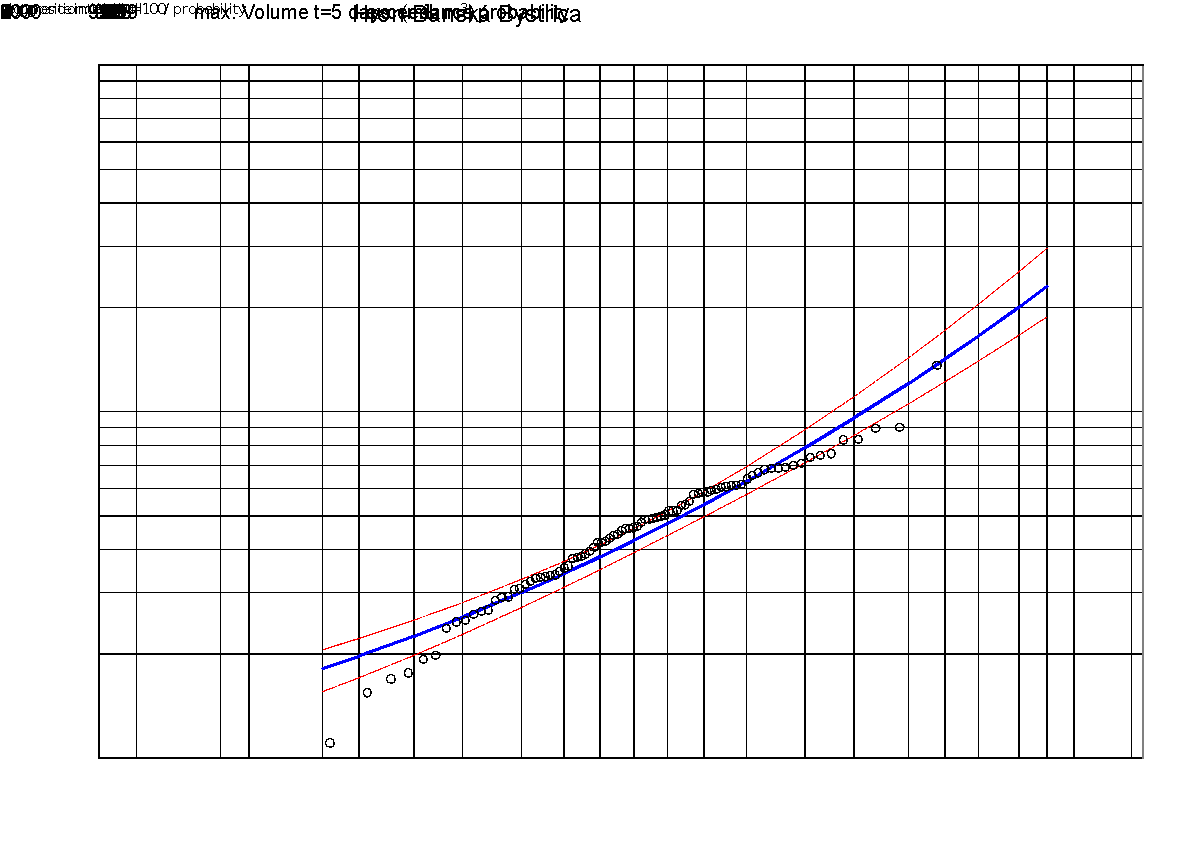
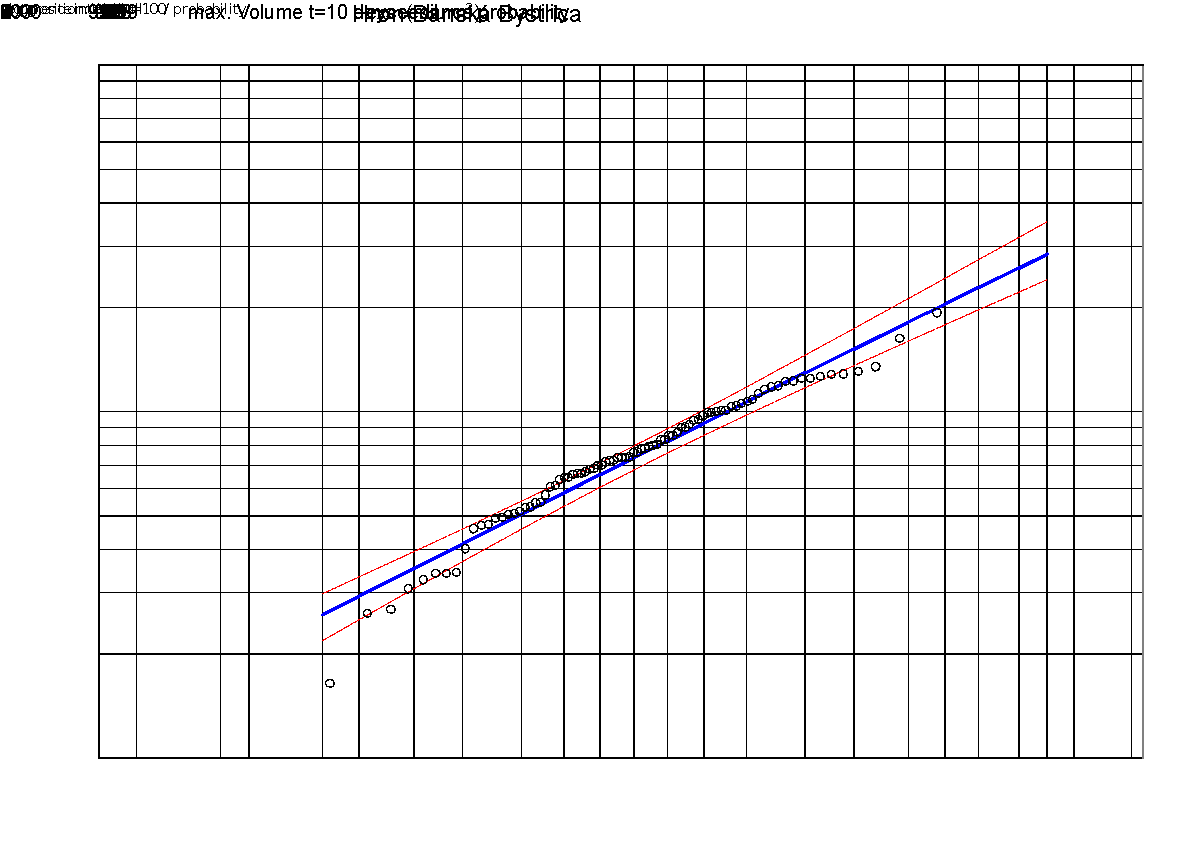
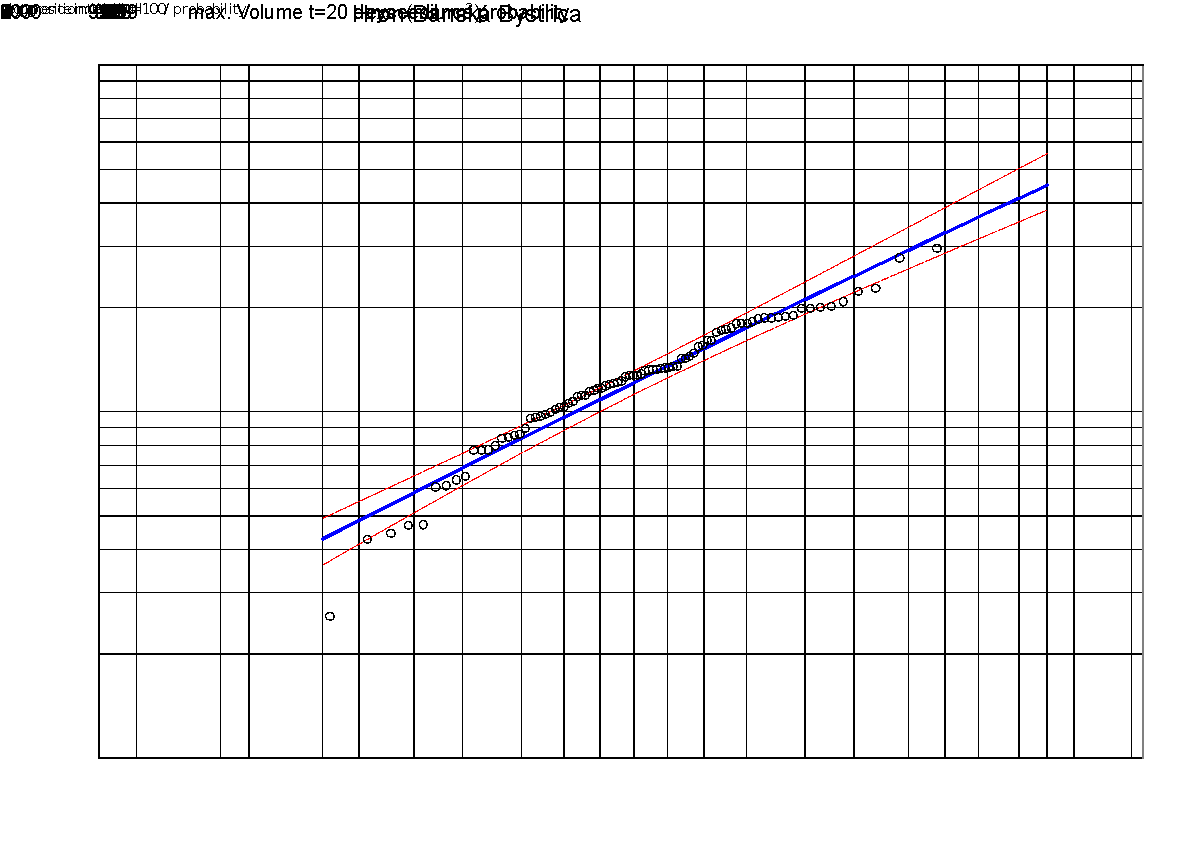
Fig. 5. Exceedance probabilities of maximum flow volume Vtmax of the Hron River:
Banská Bystrica (1931–2015) for different values runoff duration
Table 2. T-year maximum discharges Qmax [m3s-1] and T-year runoff volumes Vtmax [mil. m3],
Hron: Banská Bystrica, period of 1931-2015
N [years] | 2 | 5 | 10 | 50 | 100 | 200 | 500 | 1000 |
P [%] | 39 | 18 | 9.5 | 2 | 1 | 0.5 | 0.2 | 0.1 |
Qmax [m3s-1] | 169 | 221 | 274 | 416 | 487 | 567 | 685 | 787 |
Log-Pearson III | ||||||||
Vtmax=2 days [mil. m3] | 23.0 | 30.4 | 38.0 | 58.6 | 69.1 | 80.9 | 98.5 | 113.6 |
Vtmax=5 days [mil. m3] | 47.5 | 62.9 | 78.7 | 120.7 | 141.9 | 165.2 | 200.0 | 229.6 |
Vtmax=10 days [mil. m3] | 82.2 | 106.6 | 129.4 | 181.4 | 204.3 | 227.8 | 259.8 | 284.8 |
Vtmax=20 days [mil. m3] | 135.4 | 174.6 | 210.9 | 292.5 | 328.0 | 364.0 | 412.6 | 450.4 |
Log-normal | ||||||||
Vtmax=2 days [mil. m3] | 24.1 | 31.7 | 37.7 | 51.9 | 58.4 | 65.0 | 74.1 | 81.2 |
Vtmax=5 days [mil. m3] | 49.5 | 5.6 | 78.1 | 108.4 | 122.2 | 136.4 | 155.9 | 171.1 |
Vtmax=10 days [mil. m3] | 82.2 | 109.6 | 130.7 | 181.4 | 204.6 | 228.3 | 260.9 | 286.4 |
Vtmax=20 days [mil. m3] | 135.4 | 178.7 | 209.5 | 288.0 | 323.9 | 360.5 | 410.6 | 449.8 |
Gamma | ||||||||
Vtmax=2 days [mil. m3] | 24.4 | 31.9 | 37.4 | 49.1 | 53.9 | 58.5 | 64.4 | 68.8 |
Vtmax=5 days [mil. m3] | 50.7 | 65.4 | 75.8 | 98.0 | 107.0 | 115.7 | 126.8 | 135.0 |
Vtmax=10 days [mil. m3] | 84.6 | 107.3 | 124.6 | 159.1 | 173.0 | 186.9 | 204.2 | 216.9 |
Vtmax=20 days [mil. m3] | 138.8 | 175.8 | 201.9 | 256.8 | 279.1 | 300.5 | 327.8 | 347.8 |
Bivariate analysis of the dependence between maximum annual volumes with different runoff duration and maximum annual discharges using copula functions
Using copulas that combine one-dimensional marginal distributions of random variables with their associated distribution, we tried to process and analyse the interdependence structure of the variables Qmax and Vtmax. Calculated values of the Spearman ρ and Kendall's τ correlation coefficients are listed in table 3. The dependences between variables Qmax and Vtmax for t = 2, 5, 10 and 20 days are presented in figure 6. The LP III distribution was used as marginal distribution. Archimedean copula functions (Clayton, Gumbel-Hougaard and Frank) were used in our analysis.
Table 3. Values of the Spearman ρ and Kendall's τ of the selected combination of Qmax and Vtmax
on Hron River: Banská Bystrica (1931–2015)
Qmax-Vtmax=2 days | Qmax-Vtmax=5 days | Qmax-Vtmax=10 days | Qmax- Vtmax=20 days | |
Spearman ρ | 0.76 | 0.69 | 0.63 | 0.611 |
Kendall's τ | 0.62 | 0.52 | 0.46 | 0.46 |
The copula parameters were calculated based on the relationship with the Kendall correlation coefficient. The Kolmogorov-Smirnov goodness-of-fit test was used to evaluate the accuracy of the parametric copula functions. Subsequently, some statistical criterions were also used (MAE, RMSE). Copula parameters for selected combination of the variables and results of the Kolmogorov-Smirnov goodness-of fit test are listed in Table 4. The results showed that all three tested Archimedean copulas achieved relatively equal estimation errors. The lowest error estimation values reached the probability calculated using Gumbel-Hougaard copula function. From a visual comparison of empirical and parametric copulas, it was also evident that the low correlation between the variables had reached a higher match between the theoretic and empirical copula function (Figure 7). Figure 8 shows simulation of 1000 pairs of variables Qmax and Vtmax calculated by Gumbel-Hougaard copula function.
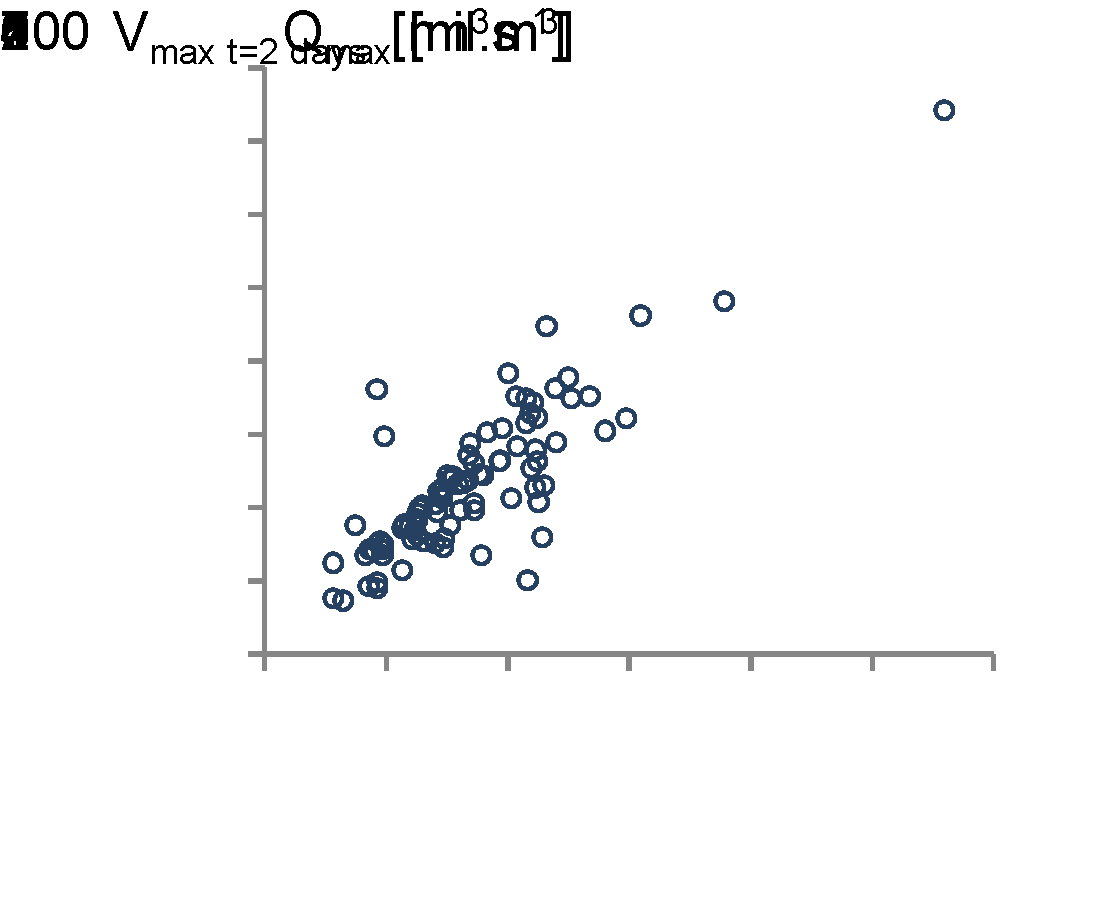
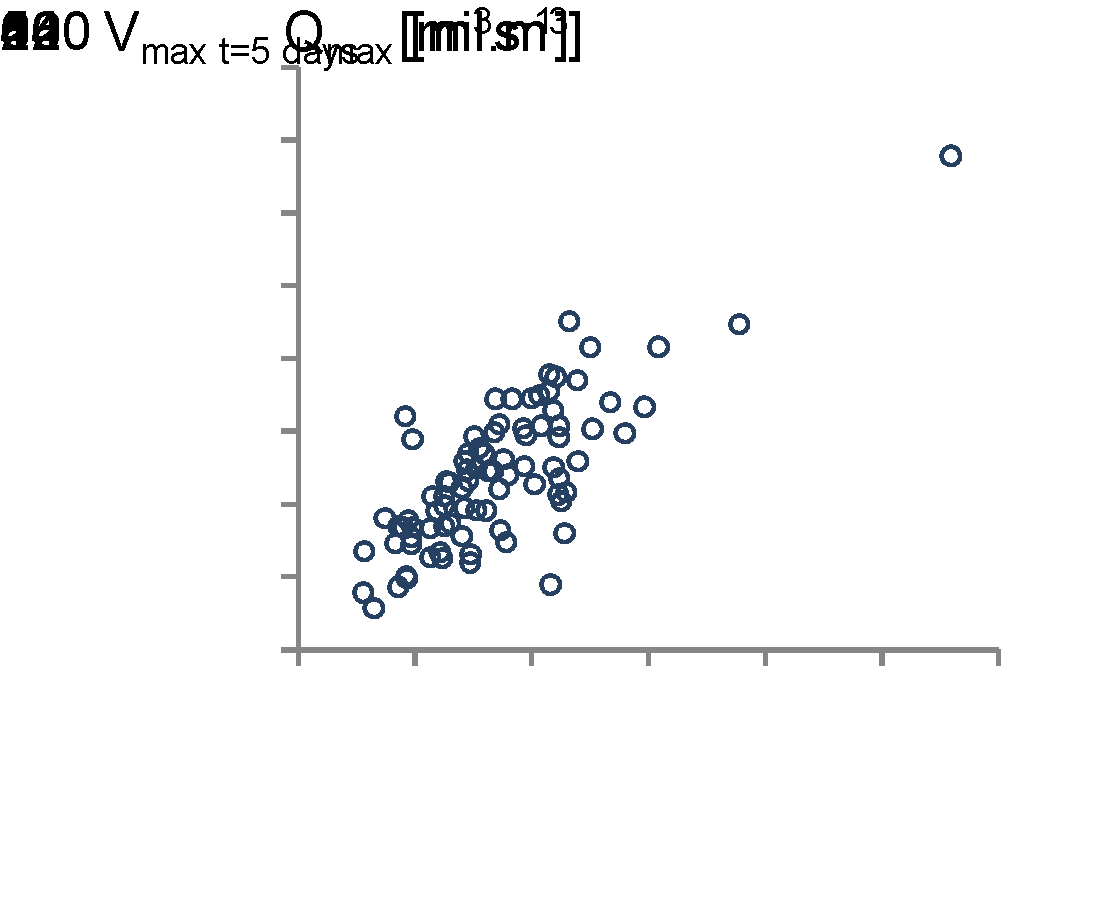
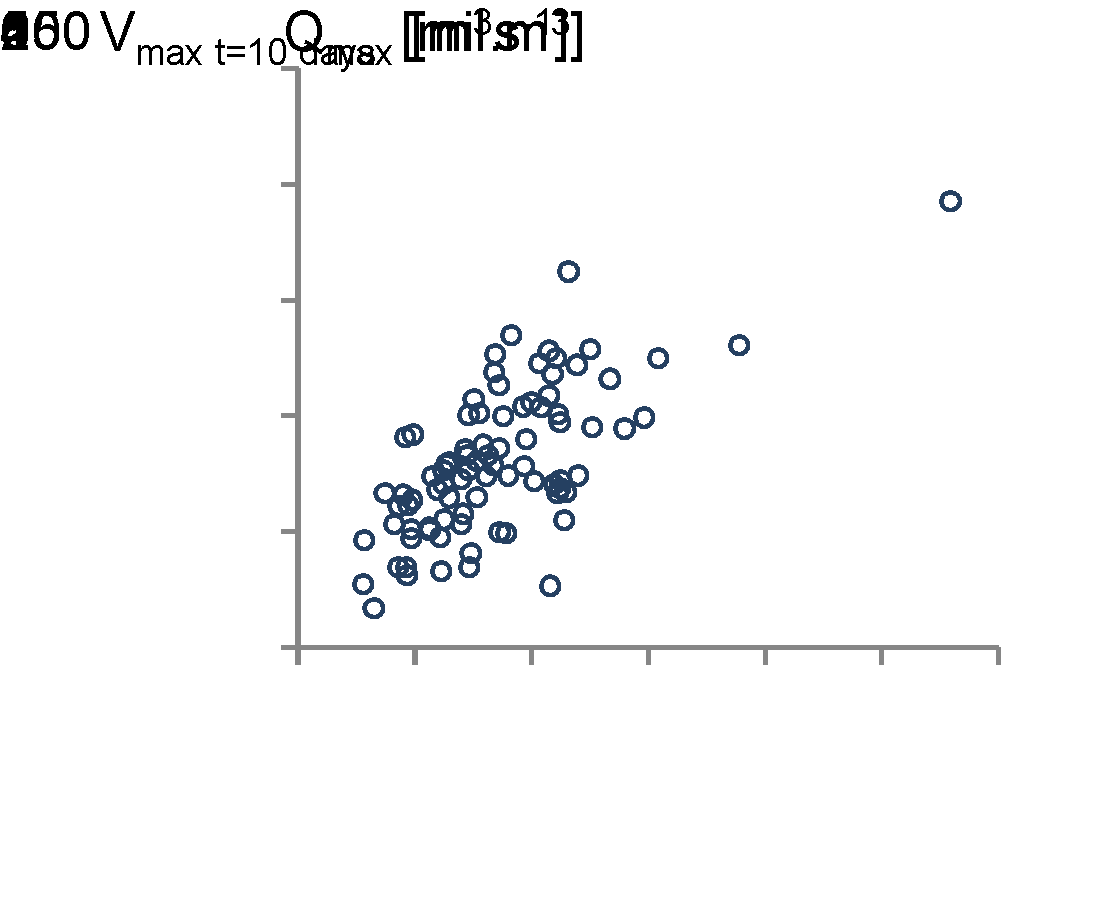
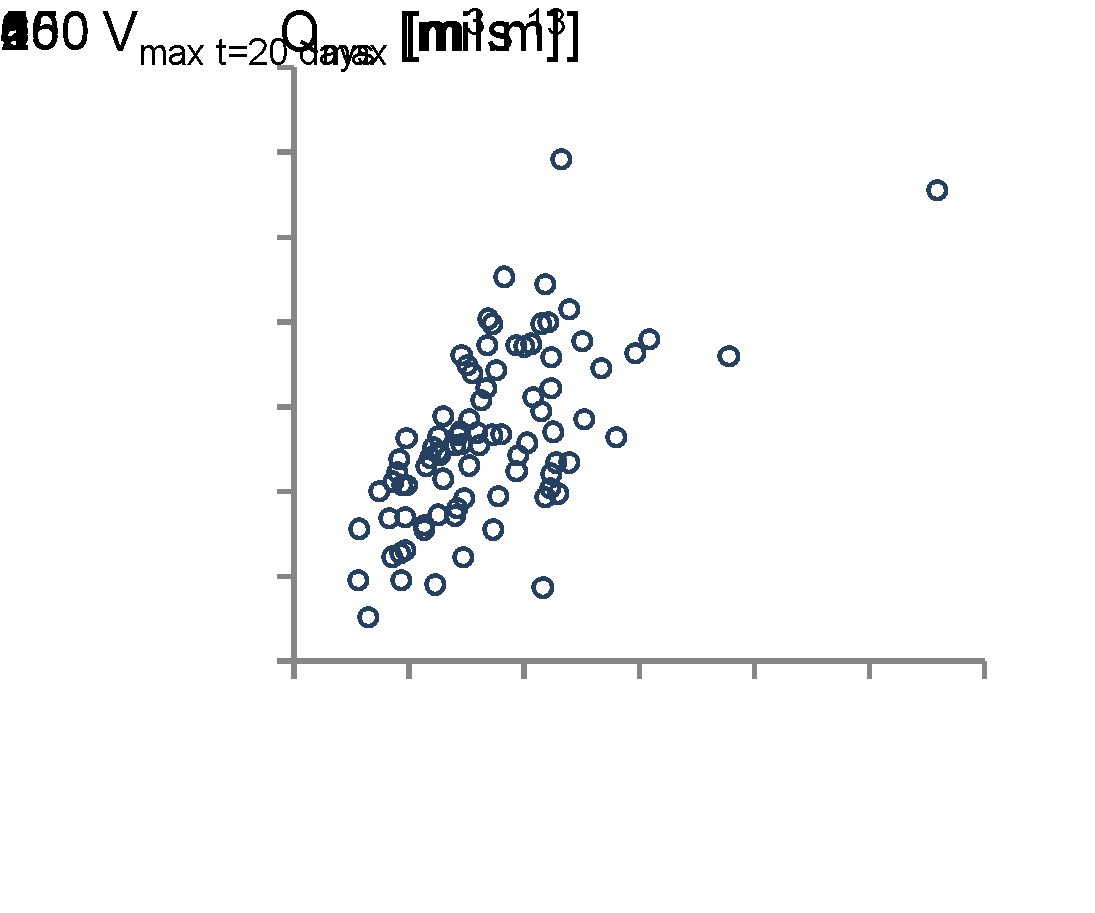
Fig. 6. Relationships between annual peak discharges Qmax and maximum wave volumes Vtmax
of the Hron River: Banská Bystrica (1931–2015) for selected runoff duration t= 2, 5, 10
and 20 days
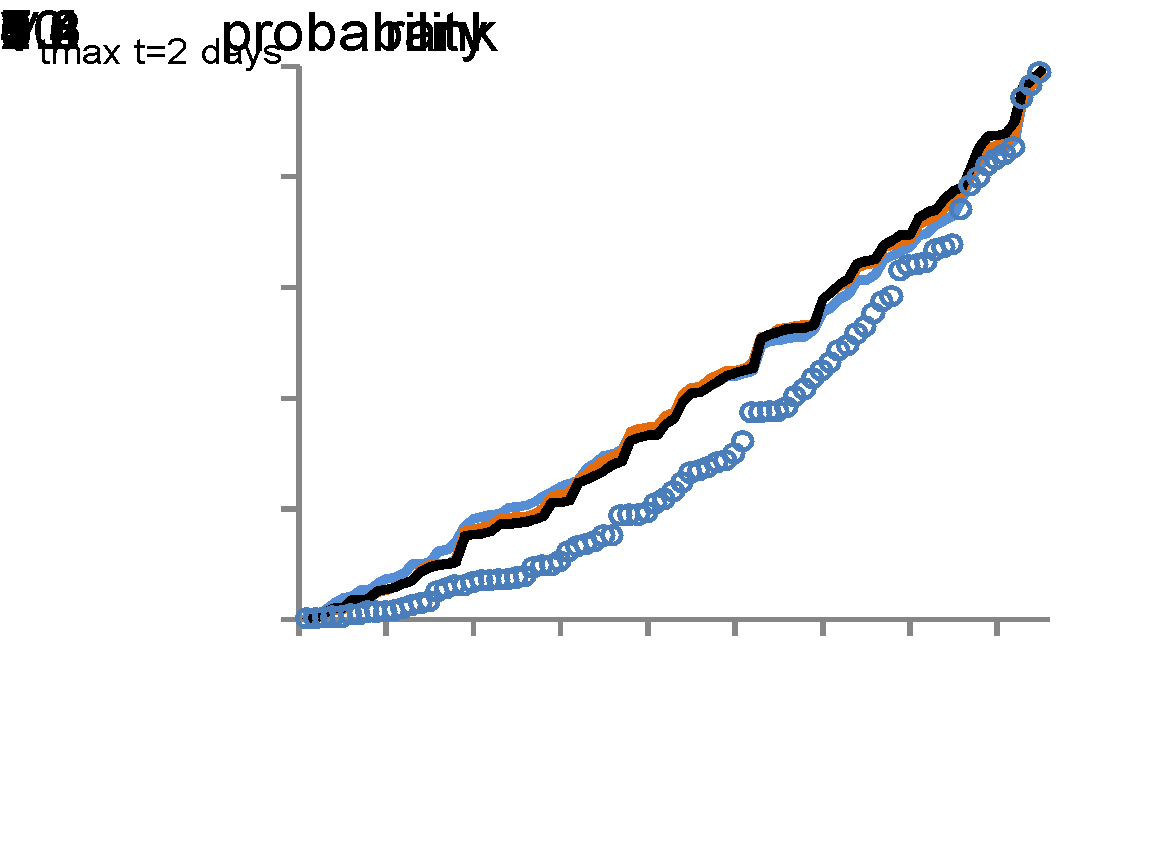
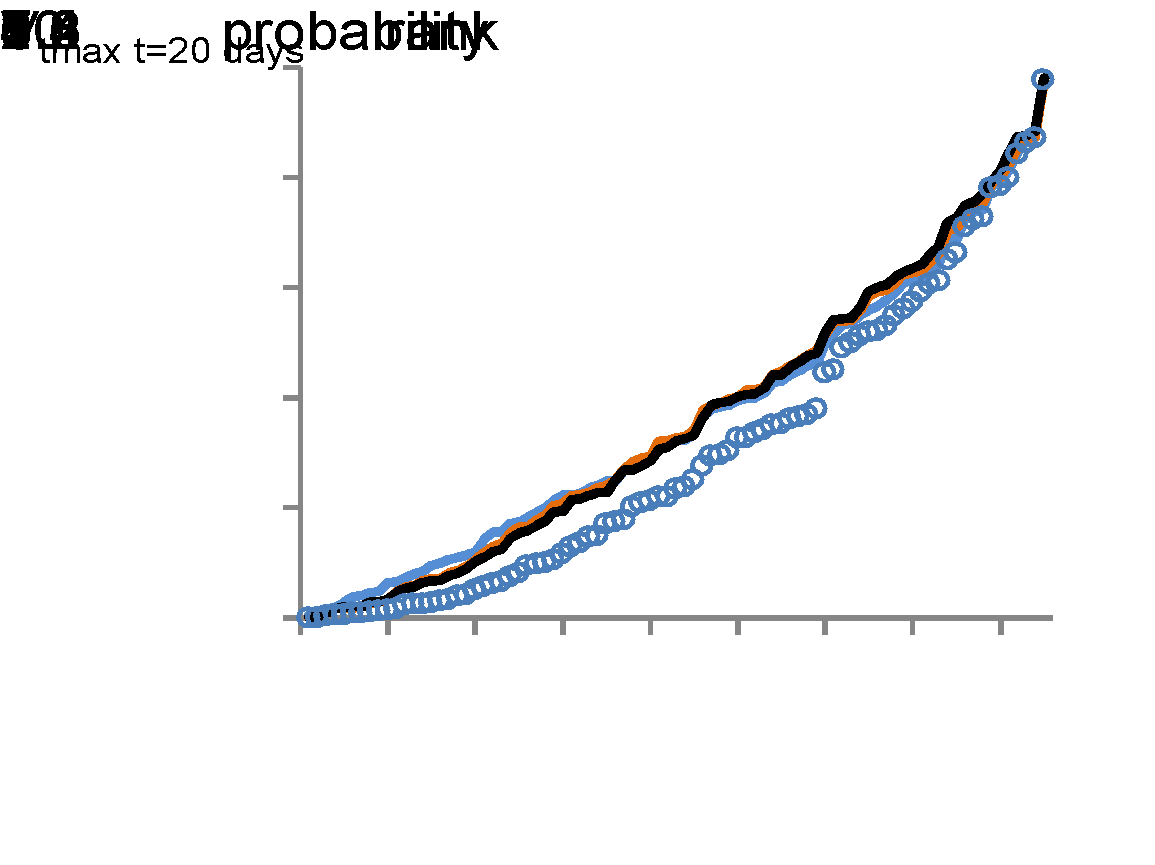
Fig. 7. Comparison of the empirical and selected parametric copula functions (Clayton, Gumbel-Hougaard Frank) of the Hron River: Banská Bystrica (1931–2015)
for Qmax and Vtmax for selected runoff duration t=2 and t=20 days
Table 4. Values of the copula parameters (C - Clayton, G-H - Gumbel-Hougaard, F – Frank)
and p-values of the Kolmogorov-Smirnov test
| Qmax - Vtmax=2d | Qmax - Vtmax =5d | Qmax - Vtmax =10d | Qmax - Vtmax =20d |
C | 3.24 | 2.20 | 1.70 | 1.67 |
G-H | 2.62 | 2.10 | 1.85 | 1.83 |
F | 8.6 | 6.2 | 5.1 | 5 |
p-value KS (C) | 0.098 | 0.098 | 0.142 | 0.270 |
p-value KS (GH) | 0.142 | 0.270 | 0.199 | 0.275 |
p-value KS (F) | 0.067 | 0.140 | 0.142 | 0.270 |
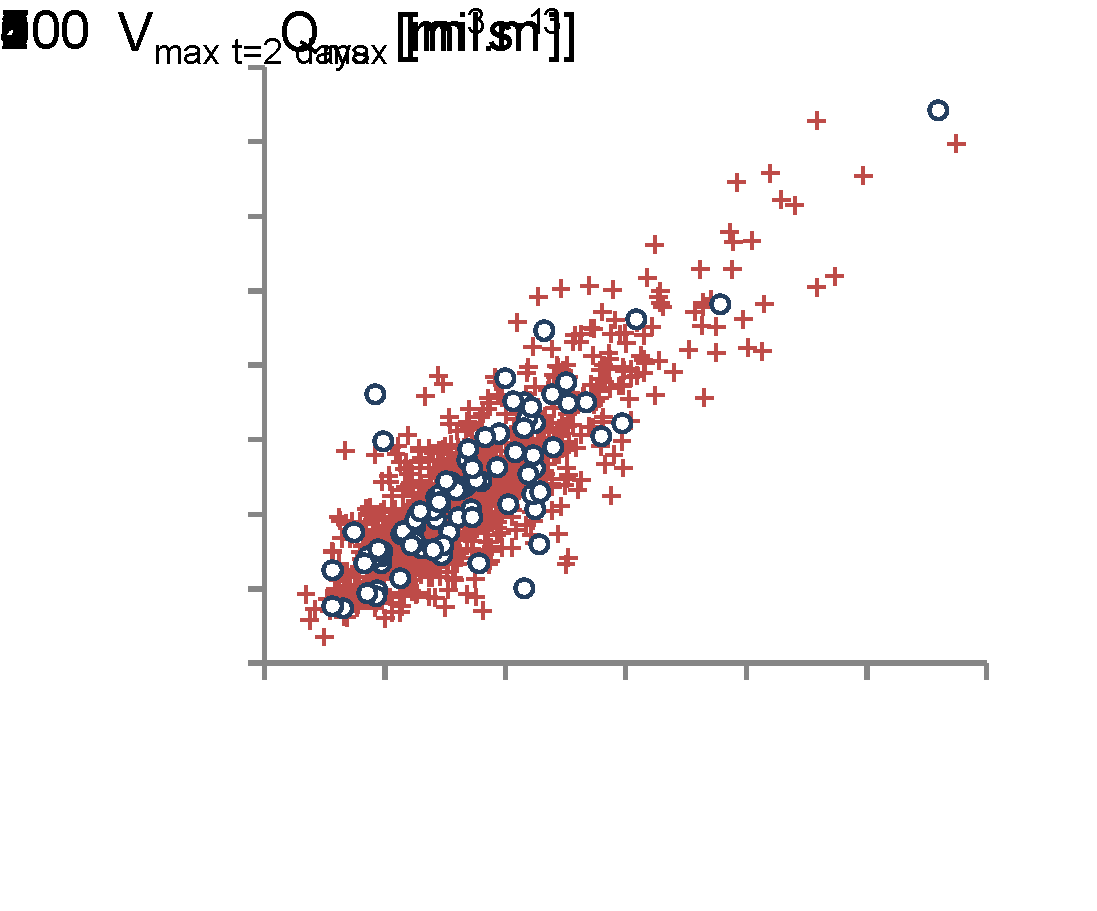
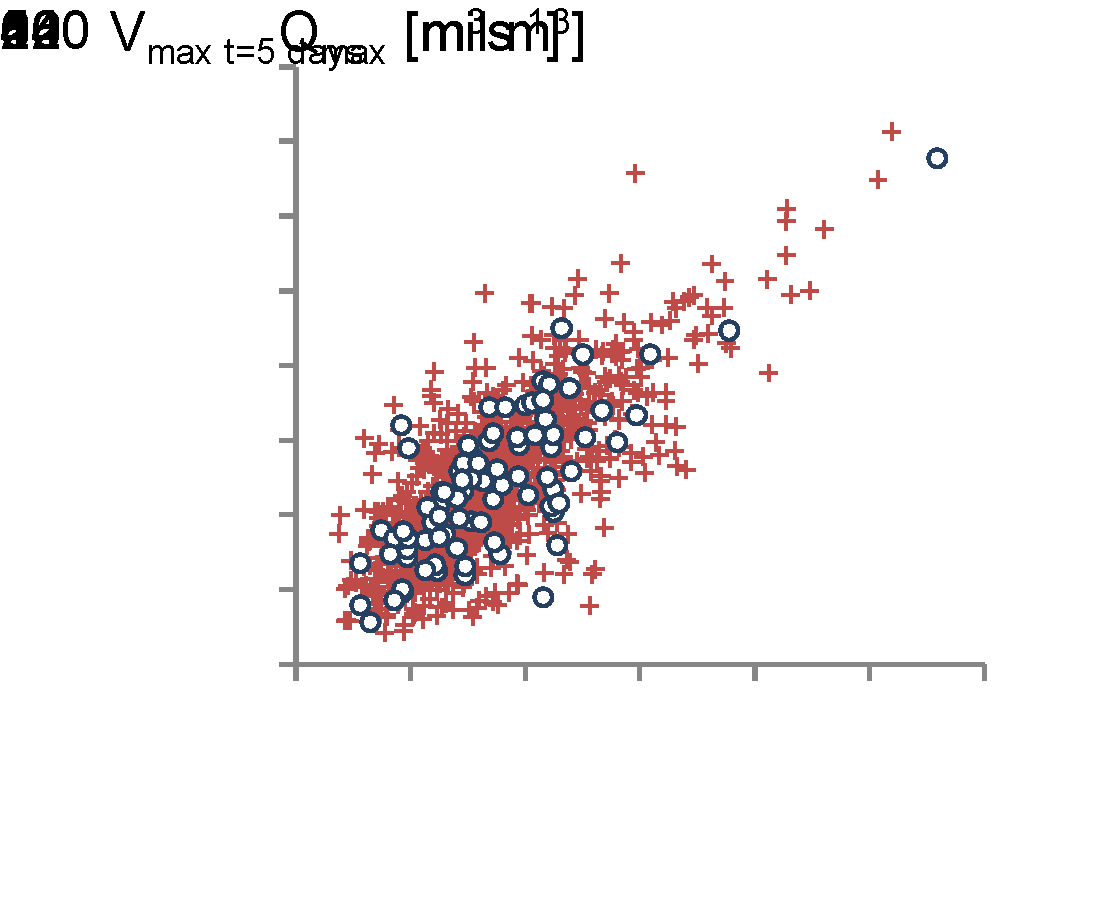
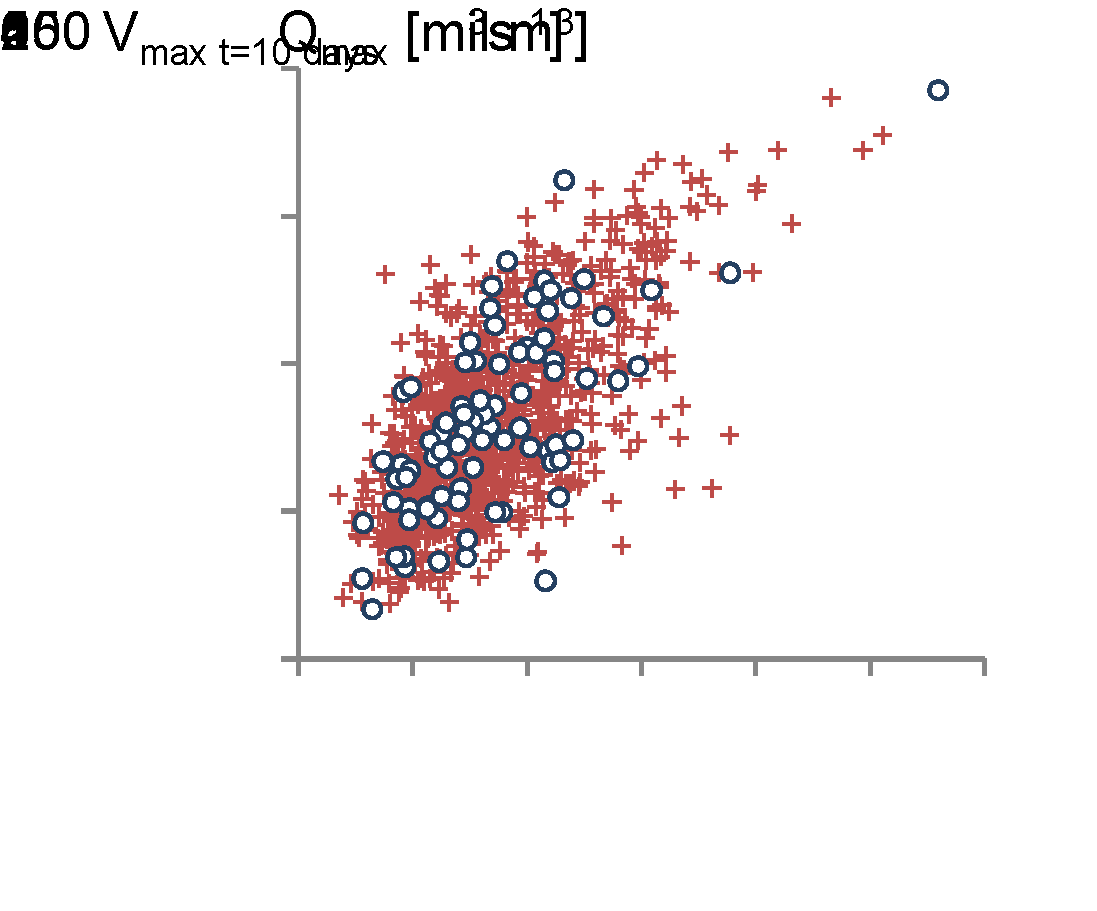
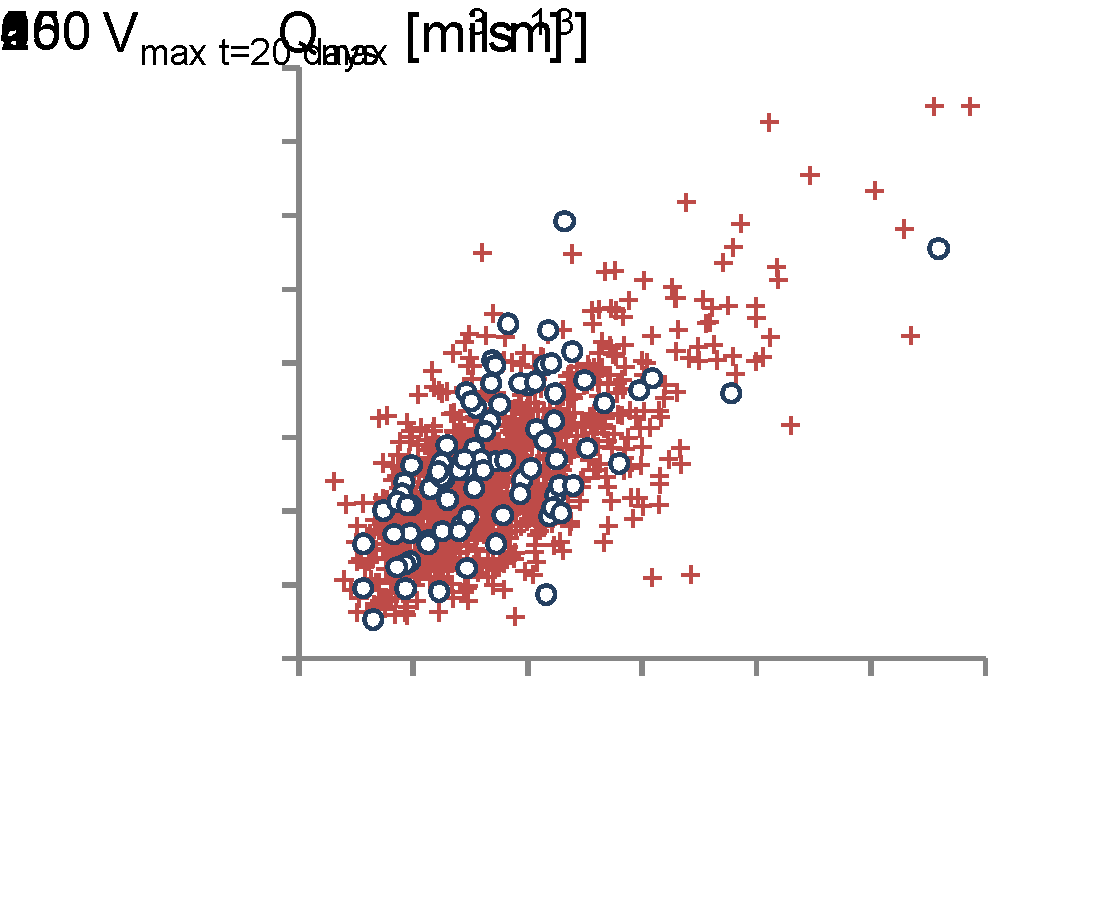
Fig. 8. Simulation of 1000 of the Qmax and Vtmax pairs using the selected Gumbel-Hougaard copula function on the Hron River: Banská Bystrica (1931–2015)
Examples of the joint and conditional return periods of the T-year maximum discharges and T-year maximum volumes for duration of the runoff t=2 and 20 days for Hron River at Banská Bystrica (1931–205) using the Gumbel-Hougaard copula function are listed in Table 5 and Table 6.
Table 5. Joint and conditional return period for maximum discharges Qmax [m3s-1] and T-year runoff volumes Vtmax = 2 days [mil.m3] on Hron River: Banská Bystrica for the period of 1931-2015
T [year] | P [%] | Qmax | Vtmax=2d [mil. m3] | FQmax | FVtmax = 2 d | CG-H | Tor [year] | Tand [year] | TV/Q [year] |
2 | 39 | 169 | 23 | 0.61 | 0.61 | 0.5252 | 3 | 2 | 8 |
5 | 18 | 221 | 30 | 0.82 | 0.82 | 0.7722 | 8 | 4 | 42 |
10 | 9.5 | 274 | 38 | 0.905 | 0.905 | 0.8781 | 15 | 8 | 155 |
50 | 2 | 416 | 59 | 0.98 | 0.98 | 0.9740 | 71 | 38 | 3566 |
100 | 1 | 487 | 69 | 0.99 | 0.99 | 0.9870 | 143 | 77 | 14304 |
Table 6. Joint and conditional return period for maximum discharges Qmax [m3 s-1] and T-year runoff volumes Vtmax=20 days [mil.m3] on Hron River: Banská Bystrica for the period of 1931-2015
T [year] | P [%] | Qmax | Vtmax=20d | FQmax | FVtmax = 20 d | CG-H | Tor [year] | Tand [year] | TV/Q [year] |
2 | 39 | 169 | 135.38 | 0.61 | 0.61 | 0.4858 | 4 | 2 | 10 |
5 | 18 | 221 | 174.65 | 0.82 | 0.82 | 0.7484 | 9 | 4 | 51 |
10 | 9.5 | 274 | 210.90 | 0.905 | 0.905 | 0.8643 | 18 | 7 | 194 |
50 | 2 | 416 | 292.53 | 0.98 | 0.98 | 0.9709 | 92 | 34 | 4577 |
100 | 1 | 487 | 327.96 | 0.99 | 0.99 | 0.9854 | 184 | 69 | 18420 |
CONCLUSIONS
The first part of the paper deals with the determination of the annual maximum discharge volumes on the Hron River for the duration of 2, 5, 10 and 20 days (Vtmax). The series of 84 years (1931–2015) mean daily discharges were analyzed. The empirical probability distribution of the data was compared with the theoretical Log-Pearson probability distribution. Subsequently, the maximum volumes with different duration were estimated by Log-Pearson distribution type III (LP III). The results of comparison with two other theoretical distribution types used in Slovakia: Lognormal and Gamma probability distribution showed:
- The high sensitivity of the LPIII distribution to extremes of the dataset. We can say that this probability distribution is appropriate for design hydrological values with higher values of the return period.
- Relatively small differences in the values of estimated T-year maximum volumes in compared types of theoretical probability distributions used in hydrological analyses of extremes in the Slovakia.
- The lowest values of estimated T-year volumes of a given duration, achieved Gamma theoretical probability distribution, especially for volumes with high repeat times.
In interpreting the results, it should be kept in mind that T-year maximum discharges related to the length of the analyzed data set, and therefore estimated values with very high return periods are extrapolated values. Each statistical method includes some uncertainty that may be caused by the method but also the data may be affected by certain measurement error.
The second part of our paper was focused on bivariate analysis of the relationship between Tyear maximum volumes with different duration and annual maximum discharges by three Archimedean copula functions (Clayton, Gumbel-Hougaard and Frank). The LP III distribution was used as marginal probability distribution function. The results of this analysis showed:
- From a visual comparison of the empirical and parametric copula functions, was evident that if correlation between variables is lower, than the match between the theoretical and the empirical copulas were better.
- The difference between selected theoretical copulas was not significant, but GumbelHougaard copula was the most suitable for maintaining and monitoring the interdependence of the variables.
- Subsequently joint and conditional return periods of the T-year maximum annual flows and T-year volumes with different time duration on the Hron River, were calculated. The first one defines joint return periods as: the return periods using one random variable equaling or exceeding a certain magnitude and/or using another random variable equaling or exceeding another certain magnitude. The second one is conditional return periods for one random variable, given that another random variable equals or exceeds a specific magnitude.
The results obtained from the bivariate as well as multidimensional analysis of the variables, which characterize the hydrological waves (flow, volume, time) can contribute to more reliable assessment of flood risks. Hence, they give an overview of the flood event as a whole and might be practically used in water management and in the design of flood protective systems.
ACKNOWLEDGMENT(S)
This work was supported by the project VEGA No. 2/0009/15 and it results from the project implementation of the “Centre of excellence for integrated flood protection of land” (ITMS 26240120004).
REFERENCES
Ashkar F., Rousselle J. A multivariate statistical analysis of flood magnitude, duration, and volume. Statistical analysis of rainfall and runoff. V. P. Singh ed. Mississippi State University, Mississippi. Water Resource Publication. 1982. P. 651-669.
Bačová Mitková V., Halmová D. Joint modelling of flood peak discharges, volume and duration: a case study of the Danube River in Bratislava J. Hydrol. Hydromech. 2014. Vol. 62(3). P. 186–196. DOI: 10.2478/johh-2014-0026
Beard L.R. Statistical Evaluation of Runoff Volume Frequencies. Symposium Dorcy, IASA, 1956. Dijon.
Bezak N., Horvat A., Šraj M. Analysis of flood events in Slovenian streams. J. Hydrol. Hydromech. 2015. Vol. 63(2). P. 134-144. DOI: 10.1515/johh-2015-0014
Bratranek A. Determination of protective areas of the dams. Work and Studies, Workbook 20, State Institute of Hydrology and Hydrotechnics, 1937. Prague. (In Czech)
Brunner M.I., Seibert J., Favre A.C. Bivariate return periods and their importance for flood peak and volume estimation. WIREs Water. 2016. Vol. 3(6). P. 819-833, 10.1002/wat2.1173
Gaal L., Szolgay J., Bacigal T., Kohnova S. Copula-based assessment of the relationship between food peaks and flood volumes using information on historical floods by Bayesian Monte Carlo Markov Chain simulations. Geophysical Research Abstracts. 2010. Vol. 12. EGU2010-13534-3.
Gądek W.J., Bodziony M. The hydrological model and formula for determining the hypothetical flood wave volume in non-gauged basins. Meteorol. Hydrol. Water Manage. 2015. Vol. 3(1). P. 3-10. DOI: https://doi.org/10.26491/mhwm/41759
Guo Y., Adams B. Hydrologic analysis of urban catchments with event-based probabilistic models 1. Runoff volume. Water Resources Research. 1998. Vol. 34(12). P. 3421–3431. https://doi.org/10.1029/98WR02449
Halmová D., Pekárová P., Pekár J., Onderka M. Analyzing temporal changes in maximum runoff volume series of the Danube River. IOP Conf. Series: Earth and Environmental Science 4, IOP Publishing. 2008. P. 1-8. doi:10.1088/1755-1307/4/1/012007.
Hosking J.R.M., Wallis J.R., Regional Frequency Analysis. Cambridge University Press. Cambridge. 1997. 244p. ISBN 0521019400, 9780521019408
Kohnova S., Gaal L., Bacigal T., Szolgay J., Hlavcova K., Valent P., Parajka J., Blöschl G. Process-based selection of copula types for flood peak-volume relationships in Northwest Austria: a case study. Contributions to Geophysics and Geodesy. 2016. Vol.46(4). P. 245-268. DOI: 10.1515/congeo-2016-0015
Mediero L.; Jiménez-Álvarez A.; Garrote L. Design flood hydrographs from the relationship between flood peak and volume. Hydrol. Earth Syst. Sci. 2010. Vol. 14. P. 2495-2505. DOI: 10.5194/hess-14-2495-2010
Mitková V., Pekárová P., Babiaková G. Maximum runoff volumes of different duration of the Danube River in dry and wet periods. Acta Hydrologica Slovaca. 2002. Vol. 3(2). P. 185-191.
Nelsen R.B. An introduction to Copula. Springer, New York. 2nd ed. 2006, XIV. 272p. ISBN 978-0-387-28678-5
Papaioannou G.J., Kohnová S., Bacigál T., Szolgay J., Hlavčová K., Athanasios L. Joint modelling of flood peaks and volumes: A copula application for the Danube River. Journal of Hydrol. Hydromech. 2016. Vol. 64(4). P. 382-392. DOI: 10.1515/johh-2016-0049
Pekarova, P., Szolgay, J. (eds.) Scenarios of changes in selected hydrosphere and biosphere components in the Hrona and Vah catchment areas due to climate change. Press Bratislava: Veda. 2005. 496 p. ISBN ISBN 80-224-0884-0. (In Slovak)
Pekárová P., Bačová Mitková V. Pekár J., Miklánek P., Halmová D., Liova S. Historické povodne na území Slovenska a ich význam v hydrológii. Bratislava: Veda, SAS, 2018. 135 p. ISBN 978 -80-224-1684-9.
Salvadori G., De Michele C. Frequency analysis via copulas: theoretical aspects and applications to hydrological events. Water Resour Res. 2004. Vol. 40. W12511. DOI:10.1029/2004WR003133
Shiau J.T. Return period of bivariate distributed extreme hydrological events. Stoch. Envir. Res. Risk Assess. 2003. Vol. 17. P. 42-57. DOI: 10.1007/s00477-003-0125-9
Sraj M., Bezak N., Brilly M. Bivariate flood frequency analysis using thecopula function: a case study of the Litija station on the Sava River. Hydrol Process. 2014. Vol. 29(2). P. 225-238. DOI: 10.1002/hyp.10145
Stamatatou N., Vasiliades L., Loukas A. Bivariate Flood Frequency Analysis Using Copulas. Proceedings of The EWaS International Conference on “Insights on the Water-Energy-Food Nexus”. 2018. Vol. 2(11). 635. https://doi.org/10.3390/proceedings2110635
Szolgay J., Kohnova S., Bacigal T., Hlavcova K. Proposed flood: Joint probability analysis of maximum discharges and their pertaining volumes. Acta Hydrologica Slovaca. 2012. Vol. 13(2). P. 289-296.
Szolgay J., Dzubak M., Hlavcova K. Hydrology. Drainage process and hydrology of surface waters. Slovak faculty of Civil Engineering STU. Bratislava. 1994. 277 p. (In Slovak)
Szolgay J., Gaal L., Bacigal T., Kohnova S., Hlavcova K., Vyleta R., Parajka P., Blöschl G. A regional comparative analysis of empirical and theoretical flood peak-volume relationships. J. Hydrol. Hydromech. 2016. Vol. 64(4). P. 367-381. DOI: 10.1515/johh-2016-0042
Zatkalik, G. Calculation of the basic parameters of the flow waves. PhD. thesis. 1970. 71 p. (In Slovak)