ASSESSMENT OF STATISTICAL SIGNIFICANCE
OF HISTORIC DANUBE FLOODS
Prof. Dr. Stevan Prohaska1, Aleksandra Ilić, Dipl.-Ing2, Dr. Pavla Pekarova3
1Jaroslav Černi Water Institute, Jaroslava Černog 80, 11226 Belgrade, Serbia
2University of Niš, Faculty of Civil Engineering and Architecture, Aleksandra Medvedeva 14, 18000 Niš, Serbia
3 Institute of Hydrology, Slovak Academy of Sciences, Dubravskas cesta 9, 841 04 Bratislava, Slovakia
ABSTRACT
Data on historic floods along the Danube River exist since the year 1012. In the Middle Ages, floods were estimated based on historical documents, including original handwritten notes, newspaper articles, chronicles, formal letters, books, maps and photographs. From 1500 until the beginning of organized water regime observations, floods were hydraulically reconstructed based on water marks on old buildings in cities along the Danube (Passau, Melk, Emmersdorf an der Donau, Spilz, Schonbuhen and Bratislava).
The paper presents a procedure for assessing the statistical significance of registered historic floods using a comprehensive method for defining theoretical flood hydrographs at hydrological stations. The approach is based on correlation analysis of two basic flood hydrograph parameters – maximum hydrograph ordinate (peak) and flood wave volume. The PROIL model is used to define the probability of simultaneous occurrence of these parameters. It defines the exceedance probability of two random variables, in the specific case two hydrograph parameters of the form:
P {Qmax ≥ qmax,p) ∩ (Wmax ≥ wmax,p)} = P (1)
where:
Qmax – maximum hydrograph ordinate (peak);
qmax,p – maximum discharge of the probability of occurrence p;
Wmax – maximum hydrograph volume;
wmax,p – maximum flood wave volume of the probability of occurrence p;
P – exceedance probability.
Spatial positions of the lines of exceedance of two flood hydrograph parameters and the empirical points of the corresponding parameters of the considered historic flood in the correlation field Qmax - Wmax, allow direct assessment of the exceedance probability of a historic flood, or its statistical significance. The proposed procedure was applied in practice to assess the statistical significance of the biggest floods registered along the Danube in the sector from its mouth to the Djerdap 1 Dam.
The linear trend in the time-series of maximum annual flows at a representative hydrological station and the frequency of historic floods in the considered sector of the Danube are discussed at the end of the paper.
Keywords: statistical significance, flood, correlation, exceedance probability, maximum hydrograph ordinate, flood wave volume, linear trend, flood frequency
INTRODUCTION
In general, a flood is a state of the water regime where the river stage (or discharge) increases and, as a rule, the river overtops its banks and floods the surrounding terrain. The increase in water level/discharge is relatively rapid and after a certain peak is reached, there is gradual decline. When a river overtops its banks, the discharges (flow rates) represent flood waves and are commonly depicted in flood hydrographs. The main parameters of a flood hydrograph are the maximum hydrograph ordinate (peak), flood wave volume, and flood wave duration.
Knowledge of flood discharges is essential for sizing hydraulic structures and of overriding importance from the viewpoints of safety and economical construction. Hydraulic structures sized on the basis of underestimated flood discharges lead to elevated risks of flooding, structural breaches and all the associated adverse effects. Overestimated river discharges reduce the risk but result in oversized structures, inconsistent with actual safety requirements and spending needs.
In addition to theoretical flood discharges, numerous structures need to be sized, or their conveyance capacity defined, on the basis of flood wave volumes and hydrograph shapes. Given that hydraulic structures are built to provide the required level of protection, design floods are determined by defining the theoretical values of flood hydrograph parameters: maximum hydrograph ordinate and flood wave volume of a certain probably of occurrence (or return period). When determining flood discharges and flood wave volumes, the initial assumption is that they are random quantities𝑋, which conform to a certain probability distribution of the form:
P (Xmax≥ x) = 1-F(x) (2)
where:
P (Xmax≥ x) – probability that random variable Xmax will exceed x;
Xmax – maximum value of the considered random variable (river discharge or flood wave volume);
x – value of random variable X of the required probability of occurrence; and
F(x) – theoretical distribution of random variable X.
Problems that involve extreme natural events are multi-dimensional, such that procedures which maximize the use of data and, at the same time, allow the estimation of parameters of a complex event and their correlations and probability of occurrence, have not been developed to a level that makes them easy to implement. For that reason, the World Meteorological Organization proposed in 1988 the transformation of marginal probabilities, which are generally not normally distributed, to form a normal probability distribution of multiple events. This approach is followed in many studies seeking a common probability of runoff hydrograph parameters, particularly peak and volume (Adamson, Metcalfe, Parmentier 1999).
Singh and Strupczewsky (2007) point out the importance of gaining insight into common exceedance probabilities of different runoff hydrograph parameters. They describe the role of examining the correlation between the flood wave peak and flood wave volume when modeling urban flood protection systems. There have been many attempts to adequately represent the correlation between the main parameters of a flood hydrograph and construct probability distributions in multivariate space.
Under natural conditions, river flood waves occur periodically and in different combinations of the main parameters: maximum ordinate and volume. Almost as a rule, the probabilities of these parameters do not coincide even though they are random variables. As such, when their probabilities are defined, they need to be considered jointly, as a bivariate random variable (X, Y), where X is the maximum hydrograph ordinate and Y is the flood wave volume. In such cases, the probability of the bivariate random variable (X, Y) is defined as:
P {(X ≥ x) ∩ (Y ≥ y)} = p (3)
The PROIL model (Ilić et al., 2017) was used in the present study to define the probability of a theoretical bivariate random variable (X, Y).
The proposed approach is discussed below, as applied to estimate theoretical flood hydrographs along the Danube River and its main tributaries, as well as to predict the simultaneous occurrence (coincidence) of the main parameters of theoretical hydrographs (maximum ordinate and flood wave volume) at the same river gauging stations.
METHOD – THE PROIL MODEL
The so-called “limiting runoff intensity” method (as described in detail in Prohaska and Petković, 1989) was used to define the main parameters of the theoretical flood hydrographs and their shapes. A predefined bivariate probability distribution of the two main parameters (peak ordinate and flood wave volume) was the basis for the selection of the constellations (combinations) of typical parameters for which theoretical hydrographs were defined. The hydrograph shape parameters were determined from actually observed flood hydrographs at a given gauging station.
The PROIL model (Prohaska and Ilić, 2017) is founded upon the practical application of the bivariate normal distribution function of two random variables, X and Y, or the bivariate normal distribution whose probability density is defined as follows (Prohaska, Marjanović, Čabrić, 1978):
(4)

where:
and– simultaneous occurrence of random variables X and Y, respectively;


and– mathematical expectations of X and Y;


and – standard deviations of X and Y;


– correlation coefficient of X and Y.

The first step was to determine the marginal distribution density probabilities,,and, as:


(5)

(6)

Then their cumulative probabilities are:
(7)

and
(8)

In this case, the cumulative probability distribution F(x, y), was defined as:
(9)

The second step was to determine the exceedance probabilitiesin bivariate space of probabilities (Prohaska, Marjanović, Čabrić, 1978):

(10)

For the proposed approach to be applicable in statistical analyses of different flood hydrograph parameters, it was necessary to introduce additional simplifications. In essence, the simplifications are related to the assumption that each of the considered flood hydrograph parameters conforms to the normal (log-normal) distribution, which need not be the case. The detailed theoretical background for defining a bivariate distribution function applying the graphic-analytical approach (Abramowitz and Stegun, 1972) can be found in the literature (Prohaska et al., 1999).
STATISTICAL SIGNIFICANCE OF HISTORIC FLOODS ALONG THE DANUBE
The statistical significance was analyzed using the PROIL model and official data from hydrometeorological services of the Danube countries, collected from endorsed gauging stations. Time-series of the highest annual river discharges and mean daily or instantaneous peak (daily) flows were used, from the time a given station was installed until 2013.
The following main parameters of flood hydrographs were considered: maximum annual river discharge (peak hydrograph ordinate – Qmax(m3/s), maximum flood wave volume during the year – Wmax (106m3), and duration of flood wave time base – Tb(hour), as shown in Fig. 1.
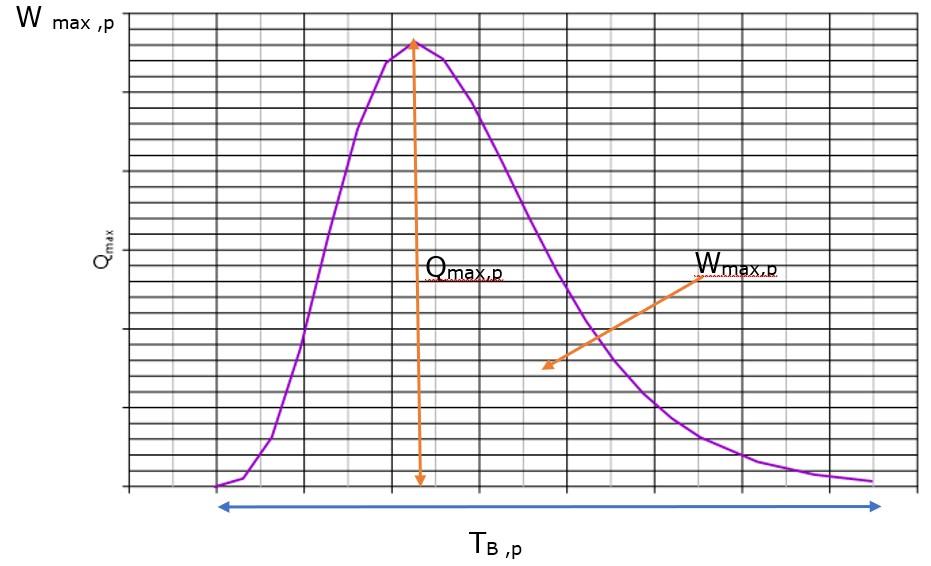
Fig.1. Shape of flood wave hydrograph
In the specific case, time-series of the highest annual discharges were uploaded directly from official hydrological databases. Time-series of maximum annual hydrograph volumes were generated on the basis of time-series of mean daily or daily discharges.
The largest annual flood wave volume Wmax,j in the j-th year was determined from the equation:
(11)

where:
Qi,j – mean daily discharge on the 𝑖-th day in the 𝑗-th year;
To – first day of the hydrograph registered in the 𝑗-th year;
Tb – time base of the maximum hydrograph in the j-th year.
This resulted in a time-series of the largest annual flood wave volumes, Wmax,j.
The maximum hydrograph ordinate (Qmax)and the maximum flood wave volume were the main flood parameters whose statistical significance was assessed. Apart from the time-series of maximum annual river discharges, such an analysis also required time-series of mean daily discharges to arrive at time-series of maximum annual flood wave volumes per Eq. (11). The following gauging stations along the Upper and Middle Danube were selected for the study: Berg, Ingolstadt, Regensburg, Hofkirchen, Achleiten, Vienna, Bratislava, Bezdan, Bogojevo, Pančevo and Orsova.
Two bivariate time-series (Qmax,j: Wmax,j), where j= 1,2,3, ….N, N – total number of data points (years), were generated from multiyear time-series of observed (empirical) maximum annual discharges and maximum annual flood waves, based on synchronous data (same years).
All the empirical points of the bivariate random variables (Qmax,i; Wmax,i) were entered into the correlation field (Qmax– Wmax) and using the PROIL model the following were defined:
- Density functions (lines of equal bivariate probabilities of occurrence):
F(Qmax;Wmax) = p, for probabilities p = 0.1, 1.0, 5.0 and 50%.
- Distribution functions (lines of bivariate exceedance probabilities):
P{(Qmax≥ qmax,P)∩(Wmax≥wmax, P) } = P, for exceedance probabilities P = 0.1, 1.0, 2.0 and 5.0 %.
The empirical points (Qmax,j; Wmax,j) above the exceedance probability line
P{(Qmax ≥ qmax,P)∩(Wmax≥wmax, P)} = 1.0% in the correlation field were declared historic points and the related flood a historic flood.
RESULTS
Coincident occurrence of Qmax and Wmax was defined for the selected gauging stations along the Danube. Figures 2/1 and 2/2 are examples of graphically represented results for the stations at Achleiten (Germany) and Bezdan (Serbia). The figures also identify the most significant floods in the study period, whose return periods were also determined.
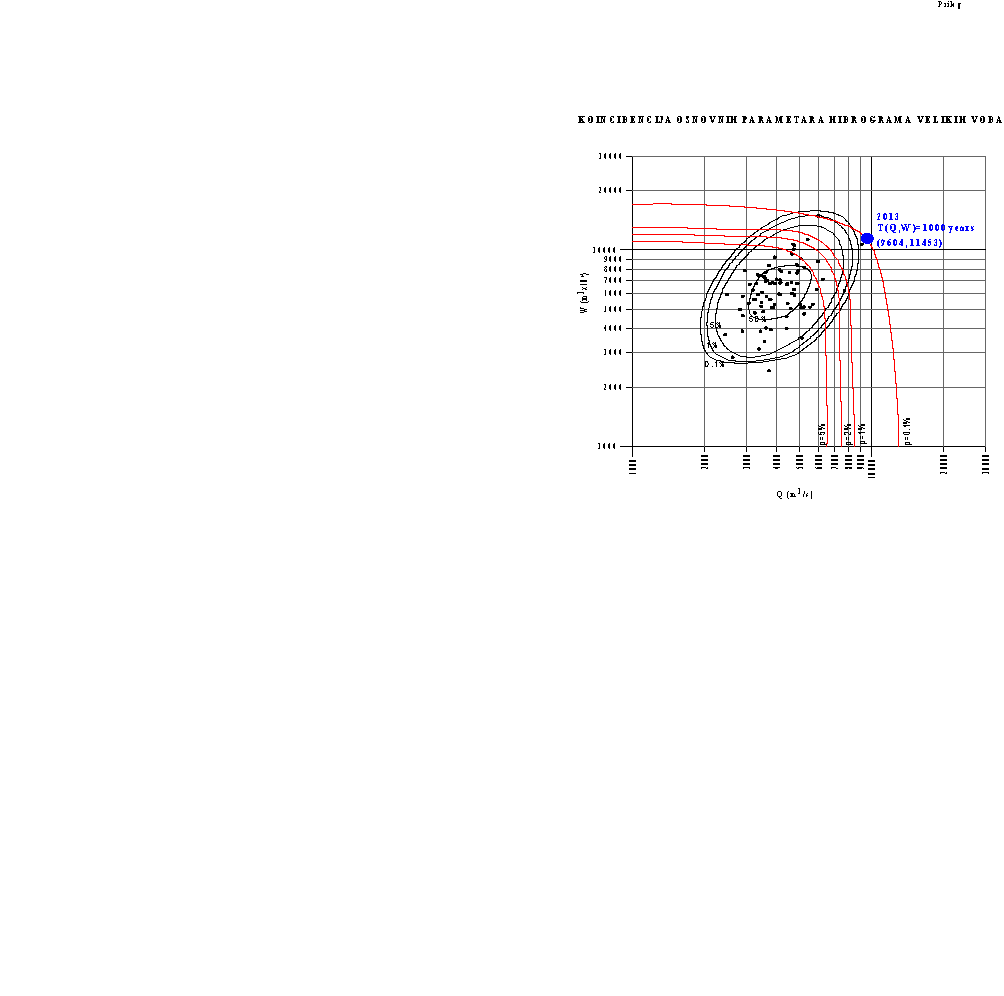
Fig. 2/1.Coincidence of main flood hydrograph parameters of the Danube at GS Achleiten
and return period of the biggest (2013) flood
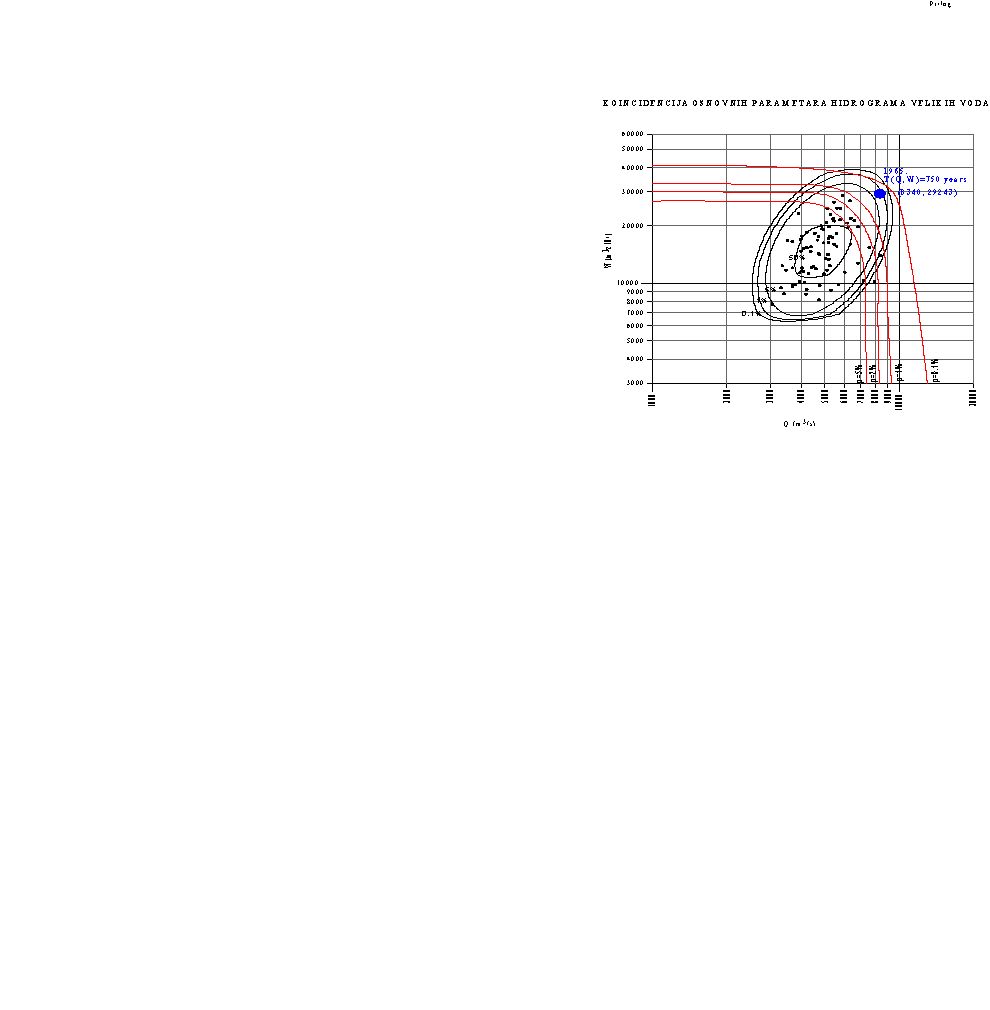
Fig. 2/2. Coincidence of main flood hydrograph parameters of the Danube at GS Bezdan
and return period of the biggest (1965) flood
As shown in Figs.2/1-2, the return periods of the biggest floods recorded from the time the gauging stations were put into operation to the year 2013 are as follows:
- Gauging station at Achleiten: the return period of the 2013 flood (coordinates Qmax=9604m3/s and W =11453 106/m3) is T(Qmax;W) = 1000 years,
- Gauging station at Bezdan: the return period of the 1965 flood (coordinates Qmax=8340m3/s and W=292453 106/m3) is T(Qmax;W) = 750 years.
The return periods of floods that exceeded the probability:
P{(Qmax ≥ qmax,P)∩(Wmax≥wmax, P)}≥ 1.0%,
or historic floods in the study period, were determined for all the considered gauging stations, including Achleiten and Bezdan. The results are shown in Table 1.
Table 1. Return periods of historic floods along the Danube from GS Berg to GS Orsova
№ | Gauging station | Number of flood waves at GS | P{(Qmax≥ qmax,P)∩(Wmax≥wmax, P) } = P <p=1% | T (years) | Analyzed period | |
Historic flood | ||||||
Year | p | |||||
1. | Berg | 1 | 1988 | 0.33 | 300 | 1930-2007 |
2. | Ingolstadt | 1 | 1965 | 0.20 | 500 | 1924-2013 |
2 | 1999 | 0.20 | 500 | |||
3. | Regensburg | 1 | 1988 | 0.25 | 400 | 1924-2013 |
2 | 2013 | 1.00 | 100 | |||
4. | Hofkirchen | 1 | 2013 | 0.65 | 150 | 1901-2013 |
5. | Achleiten | 1 | 2013 | 0.10 | 1000 | 1901-2013 |
2 | 1965 | 0.20 | 500 | |||
3 | 1954 | 0.20 | 500 | |||
6. | Vienna | 1 | 1965 | 0.20 | 500 | 1828-2006 |
2 | 1975 | 0.25 | 400 | |||
3 | 1954 | 0.33 | 300 | |||
7. | Bratislava | 1 | 1965 | 0.20 | 500 | 1876-2015 |
2 | 1899 | 0.33 | 300 | |||
3 | 2013 | 0.40 | 250 | |||
4 | 1876 | 0.90 | 110 | |||
8. | Bezdan | 1 | 1965 | 0.25 | 750 | 1931-2016 |
9. | Bogojevo | 1 | 1965 | 0.80 | 125 | 1931-2016 |
10. | Pančevo | 1 | 2006 | 1.00 | 100 | 1931-2016 |
11. | Orsova | 1 | 2006 | 1.00 | 100 | 1840-2016 |
CONCLUSION
Based on this study, the historic flood on the Danube in 1965 was recorded at the largest number of gauging stations (six) from Berg to Orsova, followed by the floods in 2013 (four) and 1954 1954, 1988 and 2006 (two each).The frequency of historic floods was the highest at GS Bratislava (four), followed by GS Achleiten and GS Vienna (three each), and GS Inglolstadt and GS Regensburg (two each). The other studied gauging stations (at Berg, Hofkirchen, Bezdan, Bogojevo, Pančevo and Orsova), registered only one historic flood each in the multiyear study period.
The most statistically significant historic flood was registered at GS Achleitenin 2013, with a return period of 1000 years, followed by the flood registered by GS Bezdan in 1965, whose return period is 750, and those registered by four gauging stations (Ingolstadt, Achleiten, Vienna and Bratrislava) whose return period is 500 years. The third in order of statistical significance were historic floods in 1954 (Achleiten) and 1999 (Ingolstadt), whose return period is 500 years. Fourth place in terms of statistical significance is held by historic floods in 1975 (Vienna) and 1988 (Regensburg), with a return period of 400 years, and fifth place by historic floods in 1899 (Bratislava) and 1988 (Berg), whose return period is 300 years. The smallest historic floods along the Danube occurred downstream from the mouth of the Drava River, only once and with much shorter return periods: at GS Bogojevo in 1965 (return period 125 years) and at GS Pančevo and GS Orsova in 2006 (return period 100 years).
ACKNOWLEDGMENT
Analyses and results presented in this paper originate from research under project Sveobuhvatnipristupodređivanjuhidrogramavelikihvodarijeke Drave mjerodavnihzaprojektiranje u hidrotehnici Assessment of Climate Change Impact on Serbia’s Water Resources 2011-2018 (TR37005) funded by the Serbian Ministry of Education, Science and Technological Development. The authors express their gratitude to the Ministry for its support.
REFERENCES
Abramowitz, M., Stegun, A., I., (1972): Handbook of Mathematical Functions with Formulas, Graphs and Mathematical Tables, Dover Publications, INC., New York, 1-1046.
Adamson P. T., Metcalfe A. V., Parmentier B., 1999: Bivariate extreme value distributions: An application of Gibbs sampler to analysis of floods, Water Resources Research, Vol. 35, No. 29, pp 2825-2832
Prohaska, S., (1999): Coincidence of flood flow of the Danube river and its tributaries, The Danube and its Basin. A Hydrological Monograph, Follow-up volume IV, Bratislava, 1-187.
Prohaska S., Ilić A., (2017): Sveobuhvatnipristupodređivanjuhidrogramavelikihvodarijeke Drave mjerodavnihzaprojektiranje u hidrotehnici, Časopiszavodnogospodarstvo, Josip Marušić, Hrvatskevode - Zavodzavodnogospodarstvo, Zagreb, 159-168
Prohaska, S., Marjanović, N., Čabrić, M., (1978): Dvoparametarsko definiranje velikih voda. Vode Vojvodine, Novi Sad, 201-210
Prohaska S., Petković T., 1989: Metode za proračun velikih voda, Deo I, Proračunve likih voda na hidrološkiizu čenim profilima, Građevinski calendar 89, Beograd.
Singh V. P., Strupczewski W. G., 2007: Editorial: Journal of Hydrologic Engineering, doi: 10.1061/(ASCE)1084-0699(2007)12:4